

Platform · ISI
Where should capital go?
A dynamic scoring engine that ingests structured economic data — GDP, FDI flows, inflation, governance and regulatory indicators — to generate a live investment readiness score for any country and sector.
- 90
- indicators per market score
- 54
- African markets covered
- 100
- point scale, sector-aware
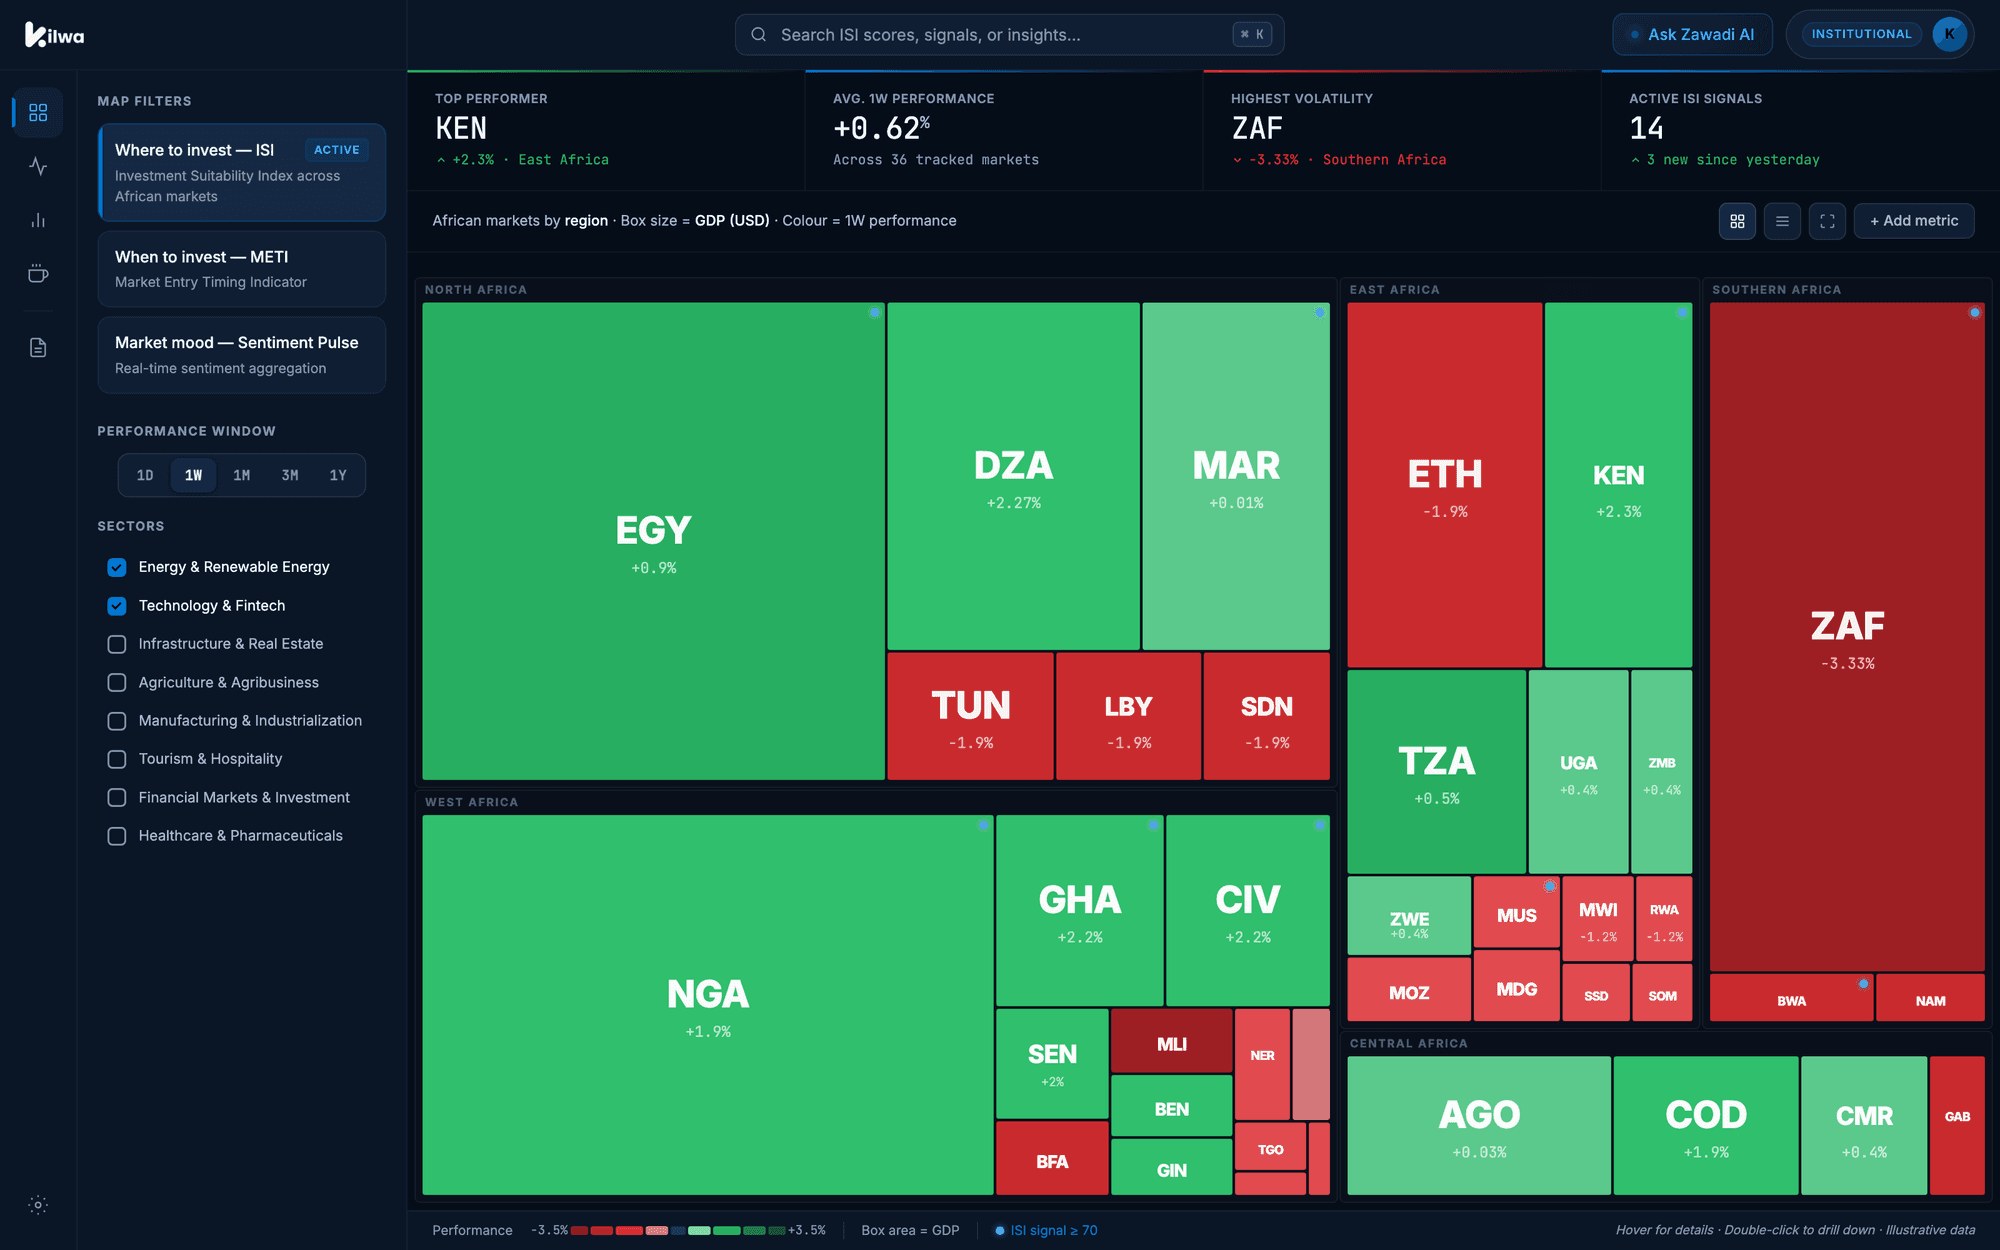
Dynamic country scoring
What ISI is
The Investment Suitability Index (ISI) is Kilwa's country and sector scoring model for frontier markets. It synthesises 90 macroeconomic, governance, regulatory and market-structure indicators into a single score out of 100 for every market Kilwa covers, refreshed as the inputs move rather than on a publication calendar.
ISI synthesises 90 macroeconomic, governance, regulatory and market-structure indicators into a single score out of 100, computed for every market we cover and refreshed as the inputs move rather than on a publication calendar.
The score is sector-aware. A market can rate highly for digital infrastructure and poorly for extractives in the same quarter, and ISI reports both rather than averaging them into a number that describes neither.
Every score decomposes. The Explainable AI layer returns the specific indicators driving the result and the direction of each contribution, which is the form risk committees can actually interrogate.
Capabilities
54 African markets
Coverage across the continent, with the scoring frame designed to extend to any data-scarce market.
90 indicators
Macroeconomic, governance, regulatory and market-structure inputs, each flagged verified or estimate.
Sector-specific scoring
Country and sector are scored together, not averaged apart.
Hierarchical ensemble
A gradient-boosted ensemble trained on clusters of comparable markets, so a thinly-covered economy borrows statistical power from its peers rather than failing for want of data.
Time-weighted inputs
An exponential decay function weights recent observations harder, so a score reflects the market as it is rather than as it averaged.
Full decomposition
SHAP-based attribution shows which indicators moved the score and by how much.
Seen in the research
Kilwa Atlas No. 6: Five Gates — Private Credit in Africa
Capital for African private credit tripled in five years, and more than half of the money raised between 2021 and 2024 was still waiting to be lent. This Atlas explains why with one idea: a private loan has to pass five gates before the lender is repaid, and in most markets at least one is shut. The Private Credit Conditions Index scores each gate from 0 to 100 in twenty markets, a screen puts all 54 into four lanes on court speed and the proceeds gate, and five enforcement precedents show what lenders actually got back and how long it took.
Read the analysis
Get started
See ISI running across our covered markets.
We'll walk your team through the module on the markets you follow.