

Industries · Corporates & operators
Multinational Corporations
Data-driven market expansion strategy that replaces analyst gut-feel with scored, explainable intelligence.
- 12
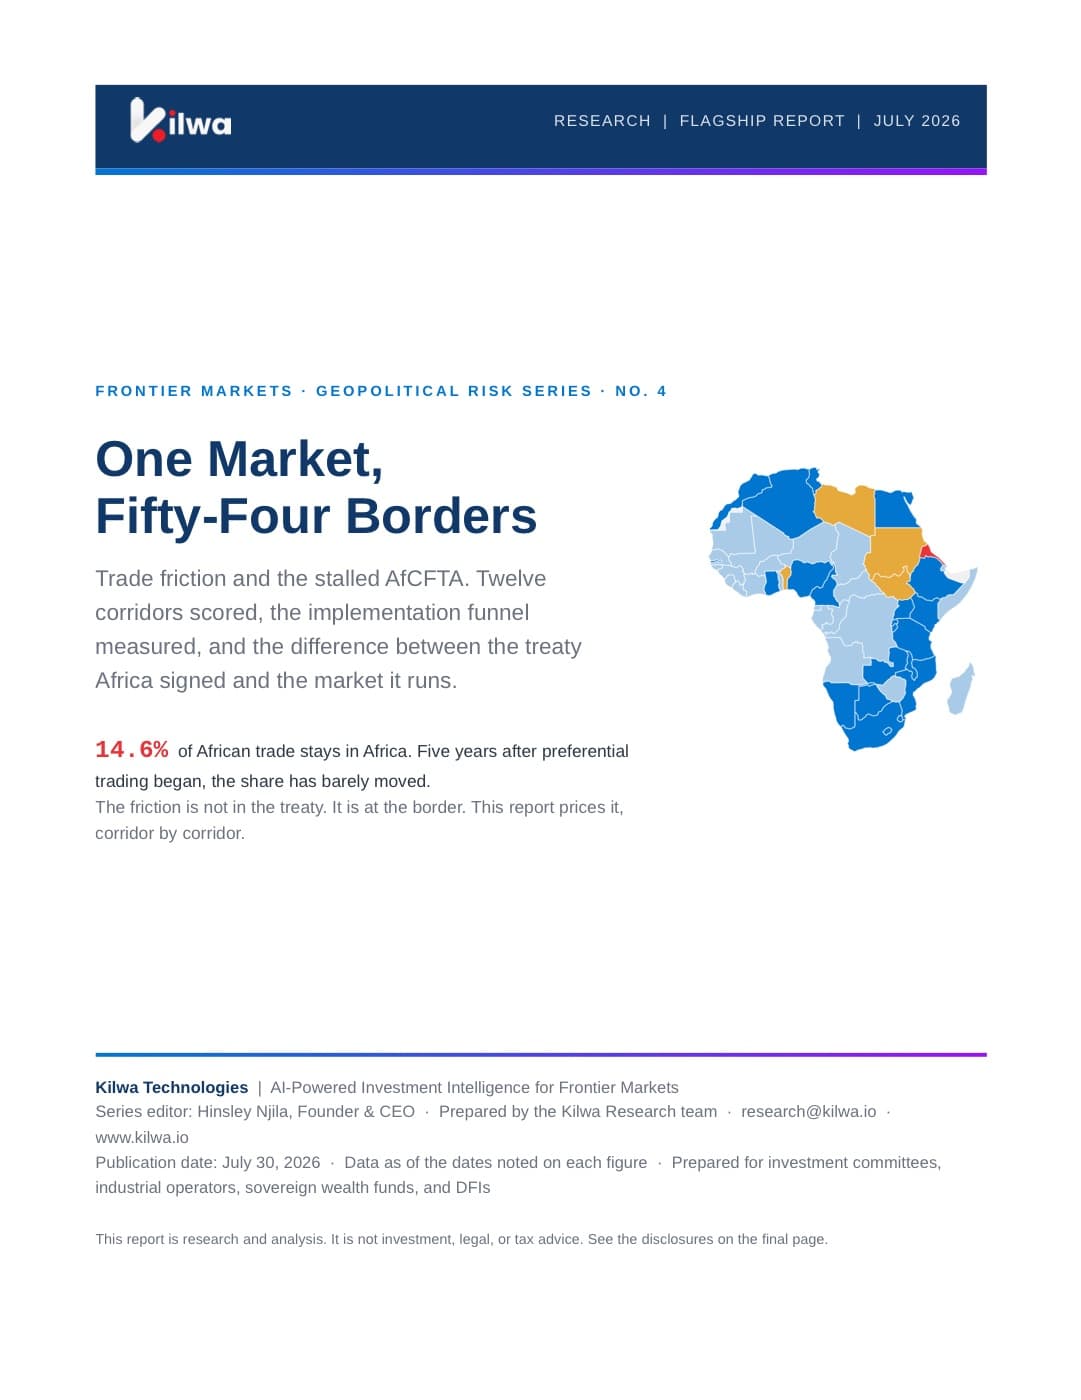
- trade corridors scored
- 97h
- SSA border compliance vs 13h OECD
- $20bn
- annual gain from removing non-tariff barriers
For an operator, African market entry is a working-capital question before it is a strategy question. Border friction, currency exposure and corridor reliability show up in unit economics long before they show up in a country risk report.
The problem
What makes this hard
Border friction is a margin tax
97 hours of export border compliance in Sub-Saharan Africa against 13 in the OECD, paid in working capital on every unit.
Rules of origin exclude the scaling sectors
92.3% of tariff lines have agreed rules of origin. Autos and textiles do not.
FX losses arrive in one line
Airtel Africa alone booked $1.26bn of FX losses in a single year.
With Kilwa
What changes
Twelve corridors scored
Trade friction measured corridor by corridor, sorted by what would actually fix it.
Expansion sequencing with timing attached
ISI ranks the markets; METI says which quarter to move on each.
Currency exposure mapped to available cover
Where cover exists, what it costs, and where it does not exist at any price.
Services for this mandate
How we work with corporates & operators.
Risk & regulatory intelligence
Risk, Resilience & Regulatory Intelligence
What changed this week, whether it touches your exposure, and which action deserves attention.
Read moreMarket entry & growth
Market Entry & Growth Strategy
Which market fits your strategy, in what sequence, and when the entry window becomes attractive.
Read moreResearch for this mandate
All insights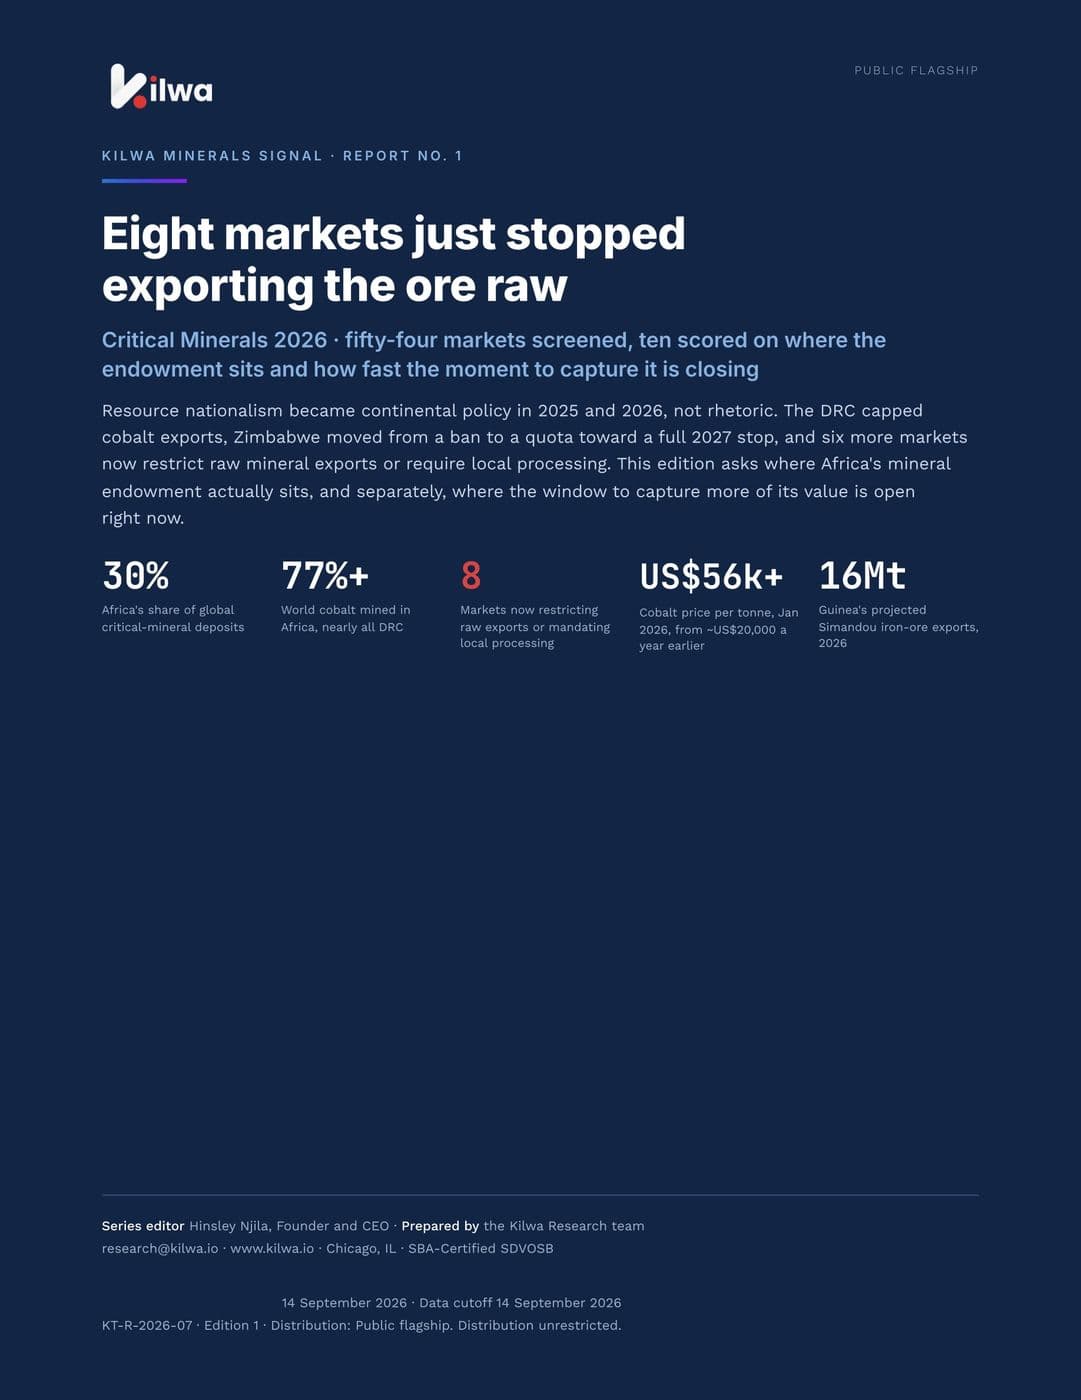
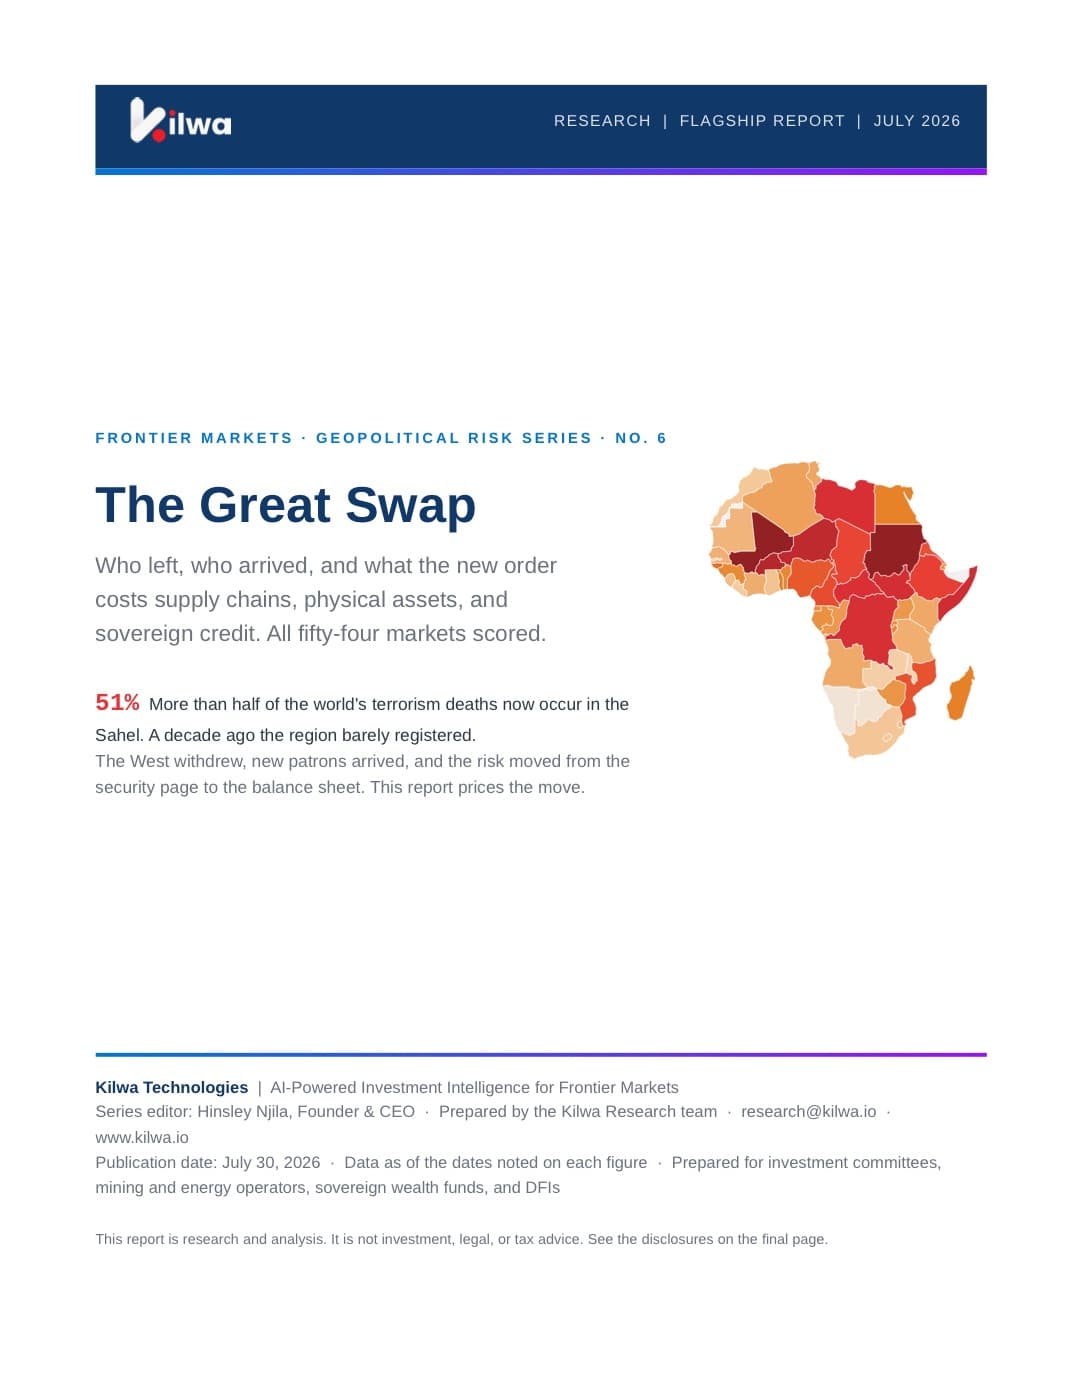

Get started
Built for corporates & operators.
A working session on the markets you follow, with the decomposition behind every score.