Macro Research · No. 1
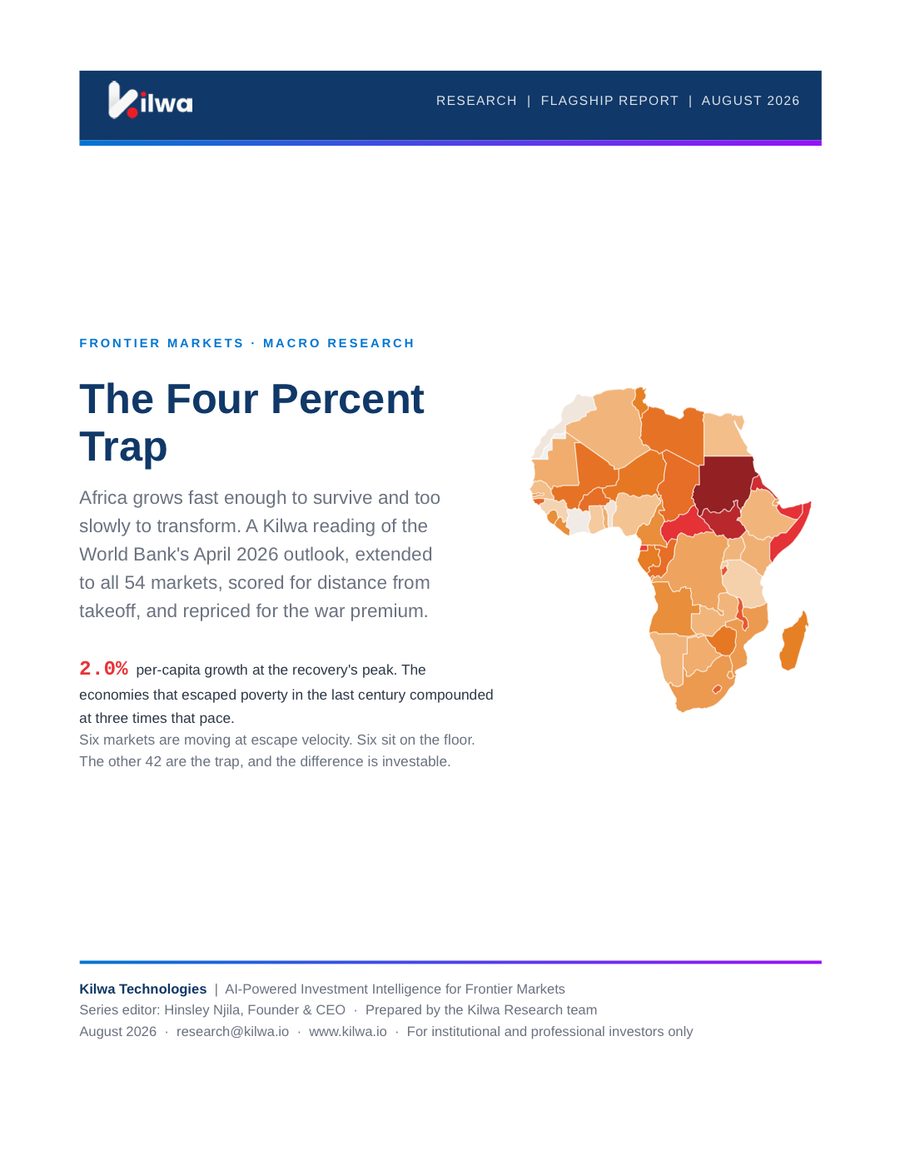
The Four Percent Trap
Africa grows fast enough to survive and too slowly to transform
A Kilwa reading of the World Bank's April 2026 outlook, extended to all 54 markets, scored for distance from takeoff, and repriced for the war premium.
Series editor Hinsley Njila, Founder & CEO · Prepared by the Kilwa Research team
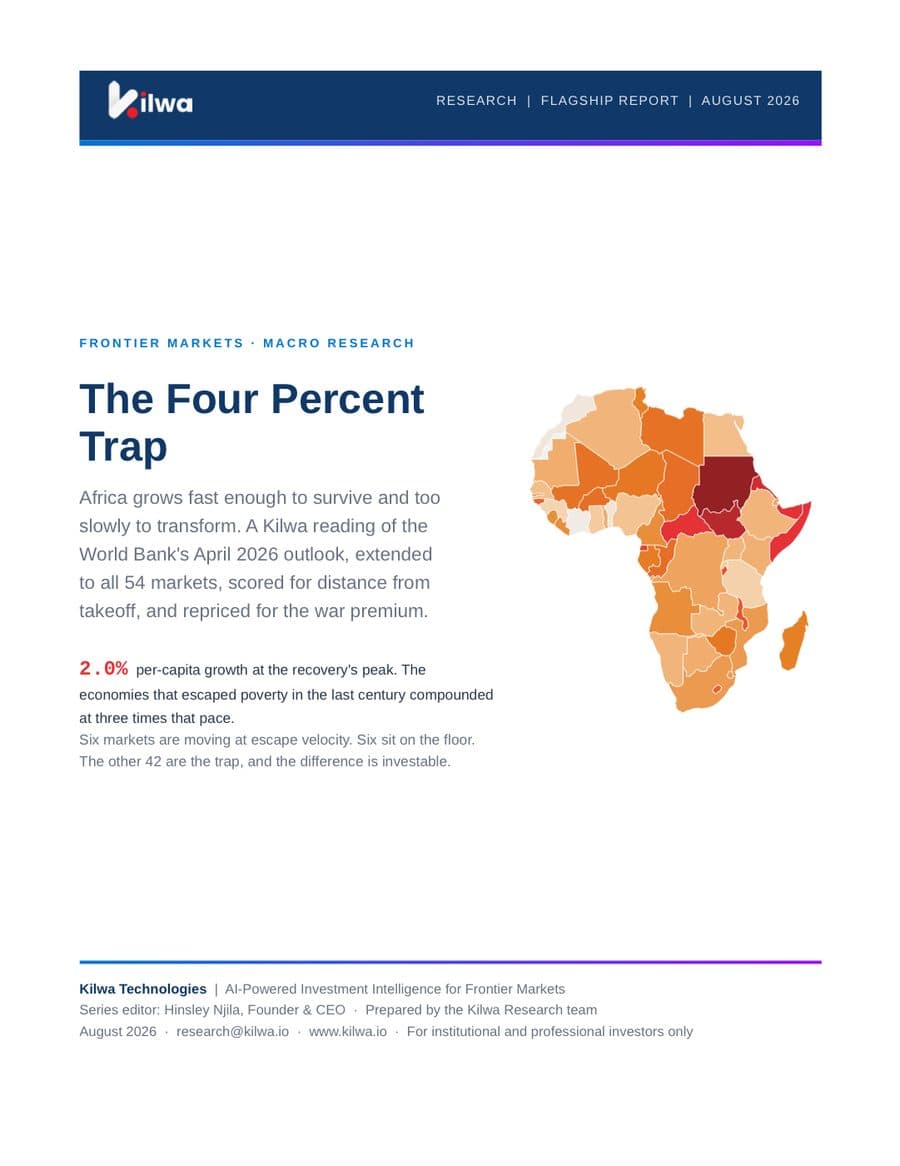
per-capita growth at the recovery's peak. The economies that escaped poverty last century compounded at three times that pace
Key takeaways
- 01
4.1% regional growth is 2.0% per person, which doubles income every 35 years. The economies that actually escaped poverty compounded at 7% or more for a generation — that gap is the trap.
- 02
Since 2014, 19 of 47 Sub-Saharan economies raised per-capita income by 25% or more while fifteen grew poorer. One continent-wide discount is being applied to two opposite trajectories.
- 03
The three largest economies hold 26% of Africa's GDP and generate 13% of its growth; the six escape-lane markets hold 13% and generate 17%. A benchmark-weighted allocation owns the wrong half.
- 04
No Sub-Saharan country sustains investment above 25% of GDP, external debt service has doubled to 18% of revenues since 2017, and the cheapest capital layer is being withdrawn: humanitarian aid to the region was cut 42% in 2025.
The report, in brief
What it is, who it is for, and what you get.
Why African growth survives but does not compound: all 54 markets scored for distance from takeoff.
Written for
Macro and sovereign investors
Which six markets are in the escape lane, and why the other 42 are where the difference is investable.
Allocators benchmarking Africa
Why the three largest economies hold 26% of GDP and generate about 13% of growth.
DFIs and policy teams
Which takeoff ingredients are missing market by market, most of them dated.
Corporate planners
Four paths over eighteen months, repriced for the war premium.
What you get
- The Takeoff Gap Score for all 54 markets: five factors, weights published
- The war overlay: what a closed Hormuz costs Africa
- Four scenarios over eighteen months, with probabilities
- Every input flagged, and the markets sitting within two points of a cutoff named
- 33 pages as a PDF, delivered the moment payment clears
The call
Africa does not have a growth problem. It has a growth distribution problem, and a capital allocation almost perfectly misaligned with the distribution. Six markets are in the escape lane, six sit on the floor, and the other 42 are the trap — where the difference is investable.
The argument in one sentence
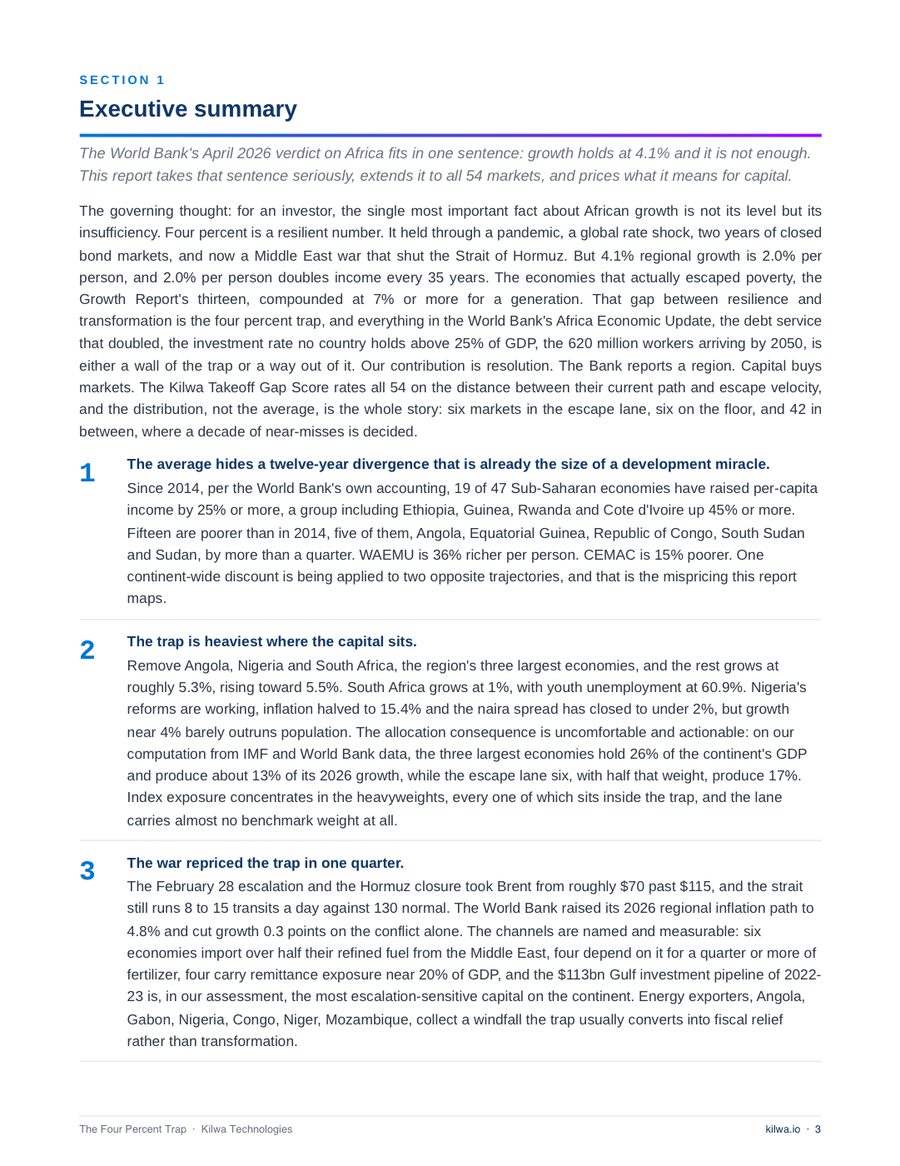
The World Bank's April 2026 verdict on Africa fits in one sentence: growth holds at 4.1% and it is not enough. For an investor, the single most important fact about African growth is not its level but its insufficiency.
Four percent is a resilient number. It held through a pandemic, a global rate shock, two years of closed bond markets, and a Middle East war that shut the Strait of Hormuz. But 4.1% regional growth is 2.0% per person, and 2.0% per person doubles income every 35 years. The economies that actually escaped poverty compounded at 7% or more for a generation. That gap between resilience and transformation is the four percent trap.
Our contribution is resolution. The Bank reports a region. Capital buys markets. The Kilwa Takeoff Gap Score rates all 54 on the distance between their current path and escape velocity — and the distribution, not the average, is the whole story.
“Not a crisis. A calendar. A market in the lane delivers a doubling inside one fund generation. The average delivers it to the next generation of allocators.”
Two Africas, already a development miracle apart
Since 2014, on the World Bank's own accounting, 19 of 47 Sub-Saharan economies have raised per-capita income by 25% or more — a group including Ethiopia, Guinea, Rwanda and Côte d'Ivoire up 45% or more. Fifteen are poorer than in 2014, five of them by more than a quarter.
The monetary unions tell it cleanest. WAEMU, eight markets on one franc, is roughly 36% richer per person than in 2014. CEMAC, six markets on the other franc, is 15% poorer. Same currency architecture, same continent, opposite decades — and one continent-wide discount applied to both.
- 01The trap is heaviest where the capital sitsRemove Angola, Nigeria and South Africa and the rest grows at roughly 5.3%. The three largest economies hold 26% of the continent's GDP and generate about 13% of its growth.
- 02The lane out-produces the heavyweightsThe escape-lane six hold 13% of GDP and generate 17% of growth — with half the mass.
- 03The money is parked mid-trapThe GDP-weighted average Takeoff Gap Score is 48 against a simple average of 55. Africa's economic weight sits in the mid-scoring elevated tier, not in the lane that compounds.
The war overlay: Hormuz closed, and Africa pays retail
On 28 February 2026, strikes on Iranian energy facilities escalated into severe disruption of the Strait of Hormuz — the channel for about 38% of seaborne crude and a fifth of global LNG. Brent ran from roughly $70 to beyond $115 by late March and sat at $84 in mid-August, with the strait still running 8 to 15 transits a day against a normal 130.
The distribution of the shock is the analytical point. For the oil exporters the war is a terms-of-trade gift. For the fuel-importing east and south it is a tax landing on economies with no fiscal space. The premium is a transfer within the trap, not a way out of it.
- 01TradeSix economies — Ethiopia, Kenya, Mozambique, South Africa, Tanzania and Uganda — import more than half their refined petroleum from the Middle East. Fertiliser dependence runs 54% in Sudan, 31% in Tanzania, 26% in Kenya.
- 02InvestmentThe Gulf's $113bn of 2022–23 greenfield commitments across 156 projects is, in our assessment, the most escalation-sensitive pipeline on the continent.
- 03FinanceFlight to safety widens spreads and weakens currencies precisely when $47–50bn a year of amortisations comes due.
- 04LabourKenya alone faces up to $40m a month of remittance losses. Remittances approach 20% of GDP in Comoros, Gambia, Lesotho and Liberia.
The engine room: why four percent does not compound
Takeoff has a known recipe: investment above a quarter of GDP, sustained for decades, funded by something. Africa's investment rate never reaches the threshold, its budgets are eaten from two sides, and its cheapest external capital is being withdrawn.
Not one Sub-Saharan country sustains investment at 25% of GDP today, and per-capita investment sits about a fifth below its 2014 level — twelve years without recovering a peak. External debt service has doubled to 18% of revenues since 2017, and interest now outbids health or education in four of five countries. Add the quiet shock: humanitarian aid to the region was cut 42% in 2025, with bilateral aid down 16 to 28%.
“The region is being asked to fund takeoff investment precisely while its cheapest capital layers — concessional and fiscal — are being withdrawn.”
Four paths over eighteen months
The base case is a grind, not a crisis. The tails are a hardened war premium on one side and a genuine widening of the escape lane on the other. Probabilities are Kilwa subjective judgments as of August 2026 — not measured frequencies, and not forecasts of returns.
- 01S1 · The grind at four percent — 50%Geneva holds without fully reopening Hormuz, Brent oscillates $75–90, the region services debt and grows 4-ish. Nothing structural changes.
- 02S2 · The war premium hardens — 25%The strait stays throttled into 2027. Oil sustains above $100, the fertiliser shock lands on the 2027 planting season, debt service climbs past 20% of revenues.
- 03S3 · The takeoff spreads — 15%The premium resolves and the elevated tier's best — Rwanda, Ghana, Uganda, Senegal, Ethiopia post-exchange — graduate toward the lane. Reachable from here.
- 04S4 · The financing snap — 10%A global risk event or second hidden-debt surprise closes the primary market. Regional growth prints below 3% and the trap becomes a ratchet.
What would change our view
Our scenario weights are hostage to a short list of dated events, and we publish the list so the August 2027 scorecard can mark us against it.
Toward S3: Hormuz transits recover and Brent settles below $75. Ethiopia completes its exchange with the 9%-growth story intact. Kenya lands its IMF programme. AGOA is renewed beyond its December 2026 cliff. Toward S2/S4: the strait stays throttled into 2027, a second hidden-debt discovery lands anywhere in the region, or any escape-lane market loses its growth anchor — Guinea's Simandou schedule being the most fragile.
The single highest-frequency indicator, published weekly, is the Hormuz transit count.
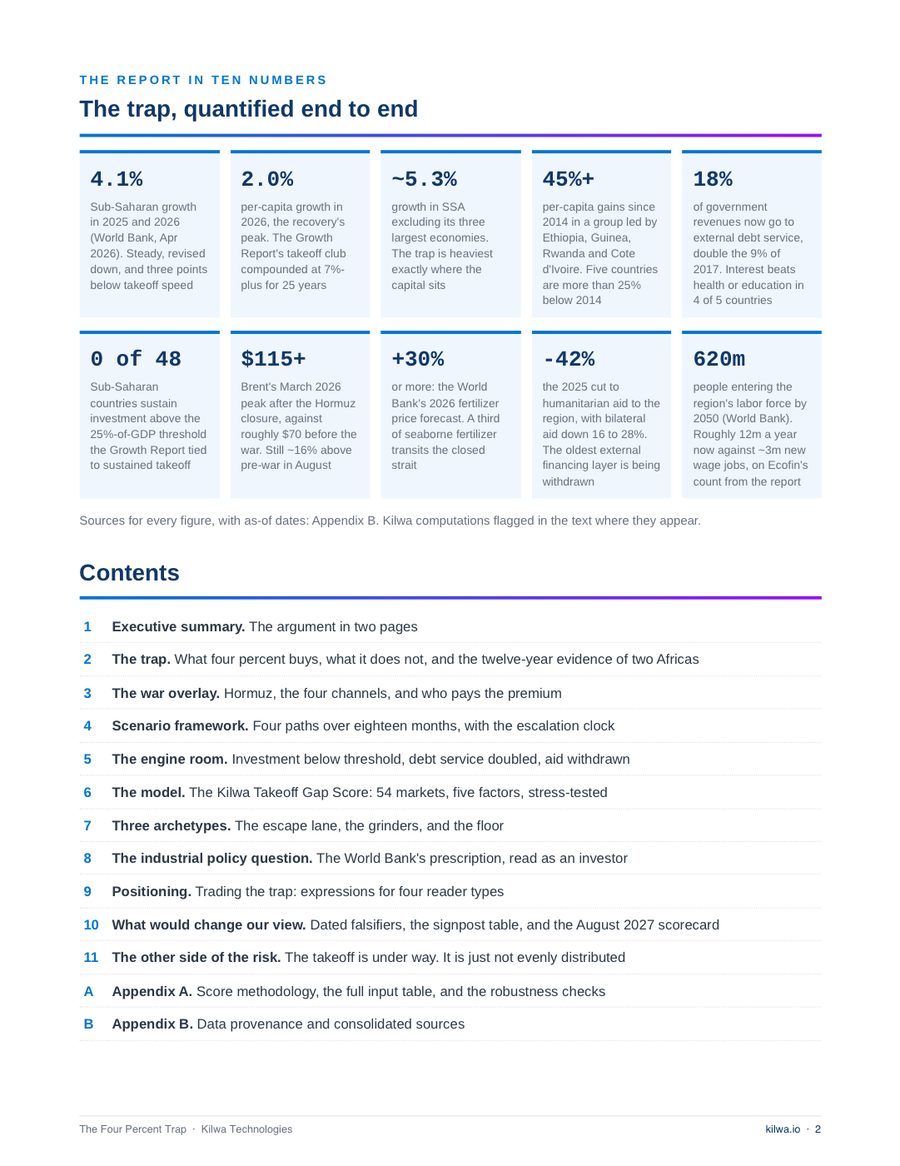
The numbers
- 4.1%
- Sub-Saharan growth in 2025 and 2026 (World Bank, April 2026) — steady, revised down, three points below takeoff speed
- 0 of 48
- Sub-Saharan countries sustain investment above the 25%-of-GDP threshold the Growth Report tied to sustained takeoff
- 18%
- of government revenues now go to external debt service, double the 9% of 2017
- 620m
- people entering the region's labour force by 2050 — roughly 12m a year against ~3m new wage jobs
The model, in one table
Kilwa Takeoff Gap Score
| Tier | Markets | What it means for capital |
|---|---|---|
| Moderate | 6 markets: Côte d'Ivoire 29, Morocco 31, Benin 32, Guinea 38, Mauritius 38, Tanzania 39 | The escape lane. Compounding growth on a real investment engine with fundable debt — the overweight candidates a benchmark will never hand you. |
| Elevated | 21 markets: Ghana 41, Rwanda 41, Nigeria 43, Egypt 44, Senegal 44, Ethiopia 46, Uganda 46, Zambia 46, Kenya 47, South Africa 52 and peers | The trap's investable edge. Two or more takeoff ingredients present, the missing ones named and mostly dated. This is where the score moves fastest in both directions. |
| High | 21 markets including Libya 61, Tunisia 58, Angola 55, Cameroon 55, Zimbabwe 60, Malawi 67, the Sahel belt and most of Central Africa | The trap's deep end. Growth below population or debt drag above capacity, usually both. Exposure through structures, commodities, or not at all. |
| Critical | 6 markets: Sudan 91, South Sudan 84, Eritrea 80, CAR 76, Somalia 76, Eq. Guinea 72 | The floor. War, collapse or enclave extraction. Stabilisation capital only — and the aid withdrawal lands here hardest. |
Scores all 54 markets 0–100; higher means a wider gap between the market's current path and growth that compounds into transformation. Five factors: growth momentum (30%), investment engine (20%), debt drag (20%), transformation readiness (15%), shock exposure (15%). Critical at 70+, High 55–69, Elevated 40–54, Moderate below 40. A structured risk ranking, not a validated predictive model — 42% of inputs carry estimate flags, and thirteen markets sit within two points of a cutoff.
By market
Markets this report tiers.
- Angola
- Benin
- Cameroon
- Central African Republic
- Côte d'Ivoire
- Egypt
- Equatorial Guinea
- Eritrea
- Ethiopia
- Ghana
- Guinea
- Kenya
- Libya
- Malawi
- Mauritius
- Morocco
- Nigeria
- Rwanda
- Senegal
- Somalia
- South Africa
- South Sudan
- Sudan
- Tanzania
- Tunisia
- Uganda
- Zambia
- Zimbabwe
Discussed by name, without a tier:
Each market page gathers every tier the published reports print for that market, dated and linked to its source.
Series editor: Hinsley Njila, Founder & CEO. Prepared by the Kilwa Research team. research@kilwa.io
This report is research and analysis. It is not investment, legal or tax advice. Kilwa scores are structured risk rankings, not validated predictive models, except where explicitly stated otherwise. It is prepared for general circulation on a published schedule and is not tailored to any recipient.
Conflicts of interest. Kilwa does not hold, trade or take positions in the securities, currencies or instruments of the markets it scores, and receives no compensation from any government, issuer or institution in exchange for a score, a rating or favourable coverage. Where a research programme is funded by a named partner, that funding is disclosed in the report.