

Industries · Sovereign wealth
Sovereign Wealth Funds
Diversification intelligence that identifies high-potential markets beyond the traditional safe havens.
- 26% / 13%
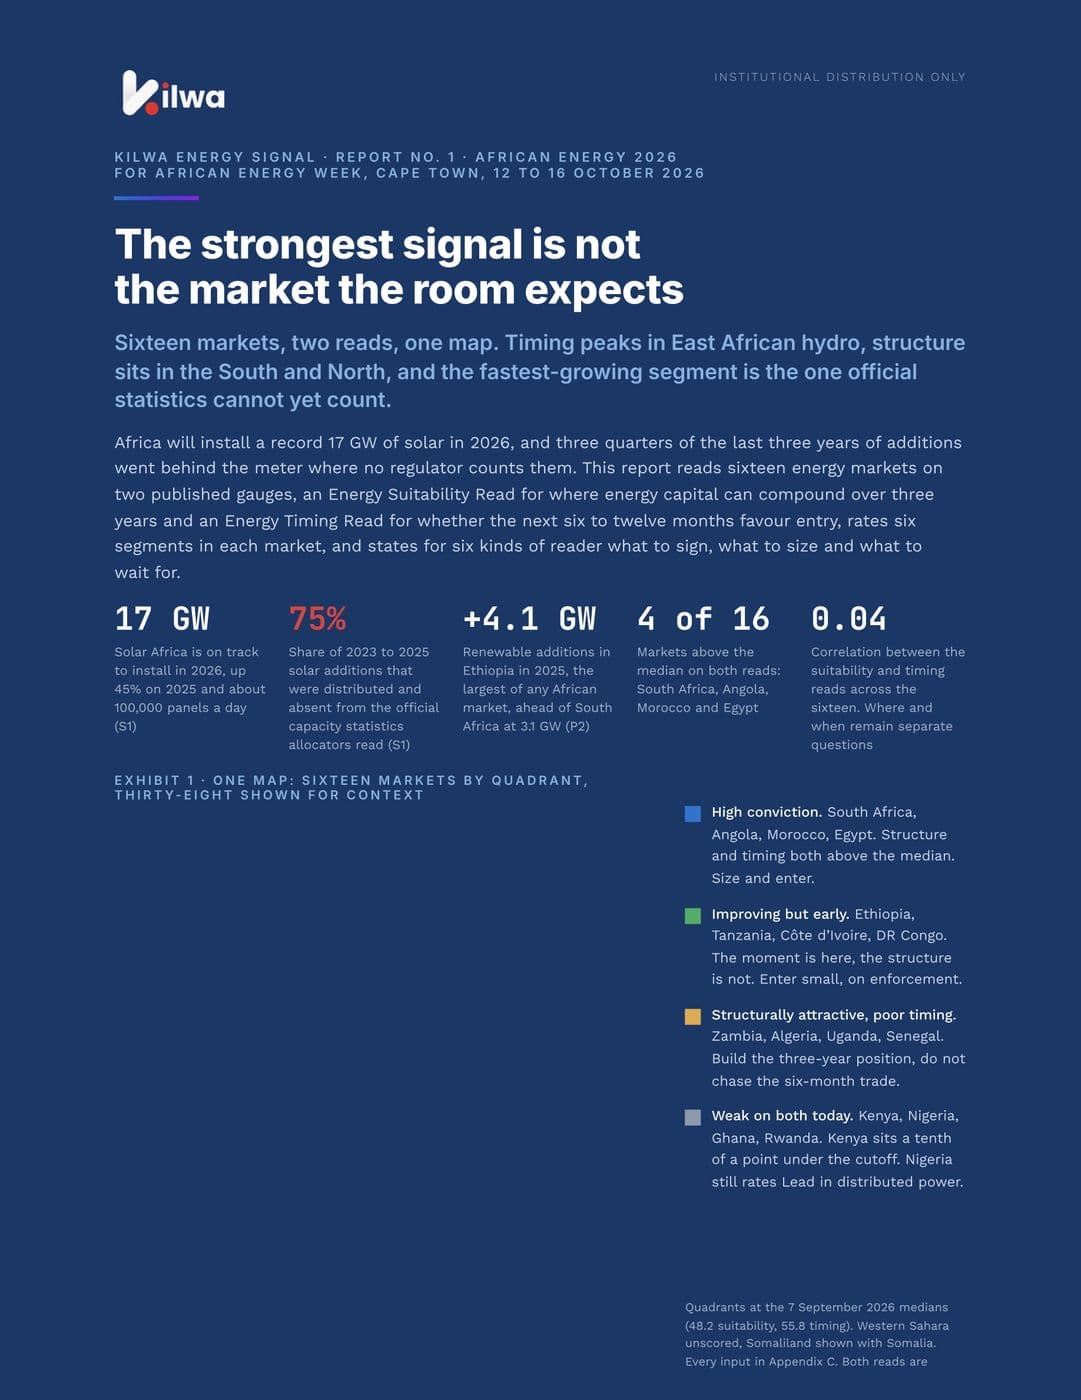
- share of African GDP held by the three largest economies, against the share of growth they generate. A benchmark-weighted allocation owns the wrong half
- 13% / 17%
- the same two figures for the six markets Kilwa scores in the escape lane. They out-produce the heavyweights on half the mass
- $19.8bn
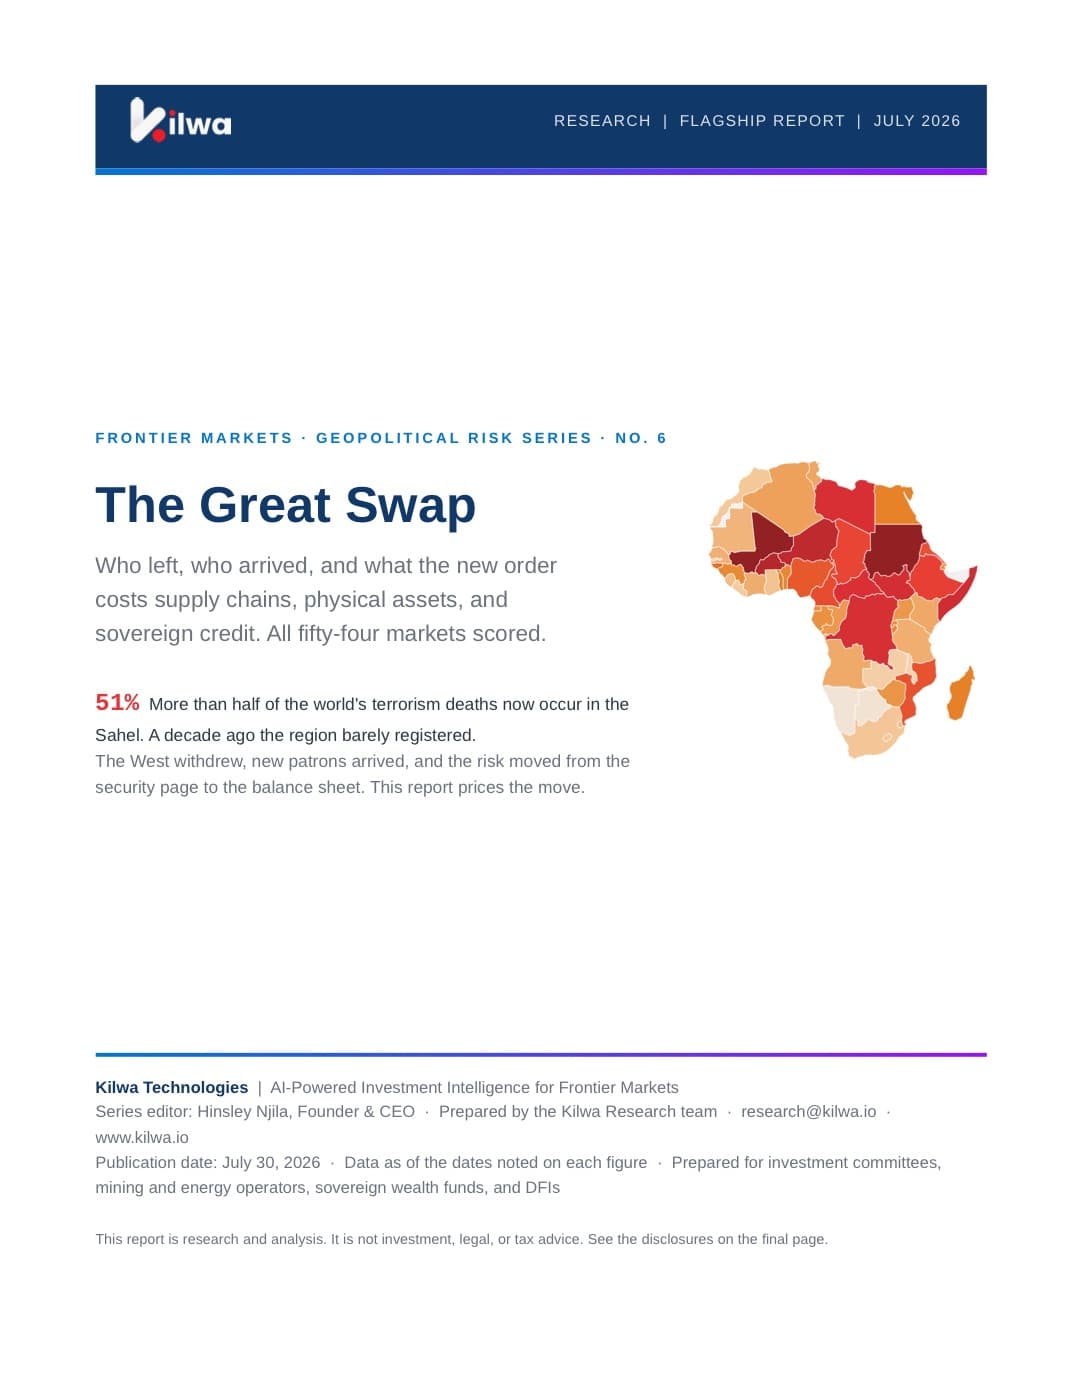
- modelled El Niño loss, by market
- 54
- markets, none omitted
Sovereign allocators looking at Africa face a research market built for a different question. Coverage is thin, English-only, and organised around describing what happened rather than scoring what to do next.
The problem
What makes this hard
Coverage stops at the obvious markets
Research depth concentrates in five or six economies. The diversification case lives in the other forty-eight.
The signal is in languages the tools do not read
Gulf sentiment on African infrastructure moves in Arabic. Regional policy publishes in French.
Tail risk is under-priced
The most Taiwan Strait-dependent economies on earth are African, and almost nobody prices that exposure.
With Kilwa
What changes
All 54 markets, scored
Not a shortlist. Every market carries an ISI score and a METI posture on the same frame.
Four-language sentiment coverage
English, French, Arabic and Swahili processed natively — signal your existing tools cannot see.
Tail risk quantified per market
Flagship geopolitical and climate reports score exposure country by country, with the loss model published.
Services for this mandate
How we work with sovereign wealth.
Capital allocation & deals
Capital Allocation, Deal & Portfolio Intelligence
Which markets fit the mandate, when to move, and what the exit is worth before you underwrite it.
Read moreSovereign capital & investment promotion
Sovereign Capital & Investment Promotion
How global capital reads your country, where the evidence is weak, and how to close the gap.
Read moreResearch for this mandate
All insights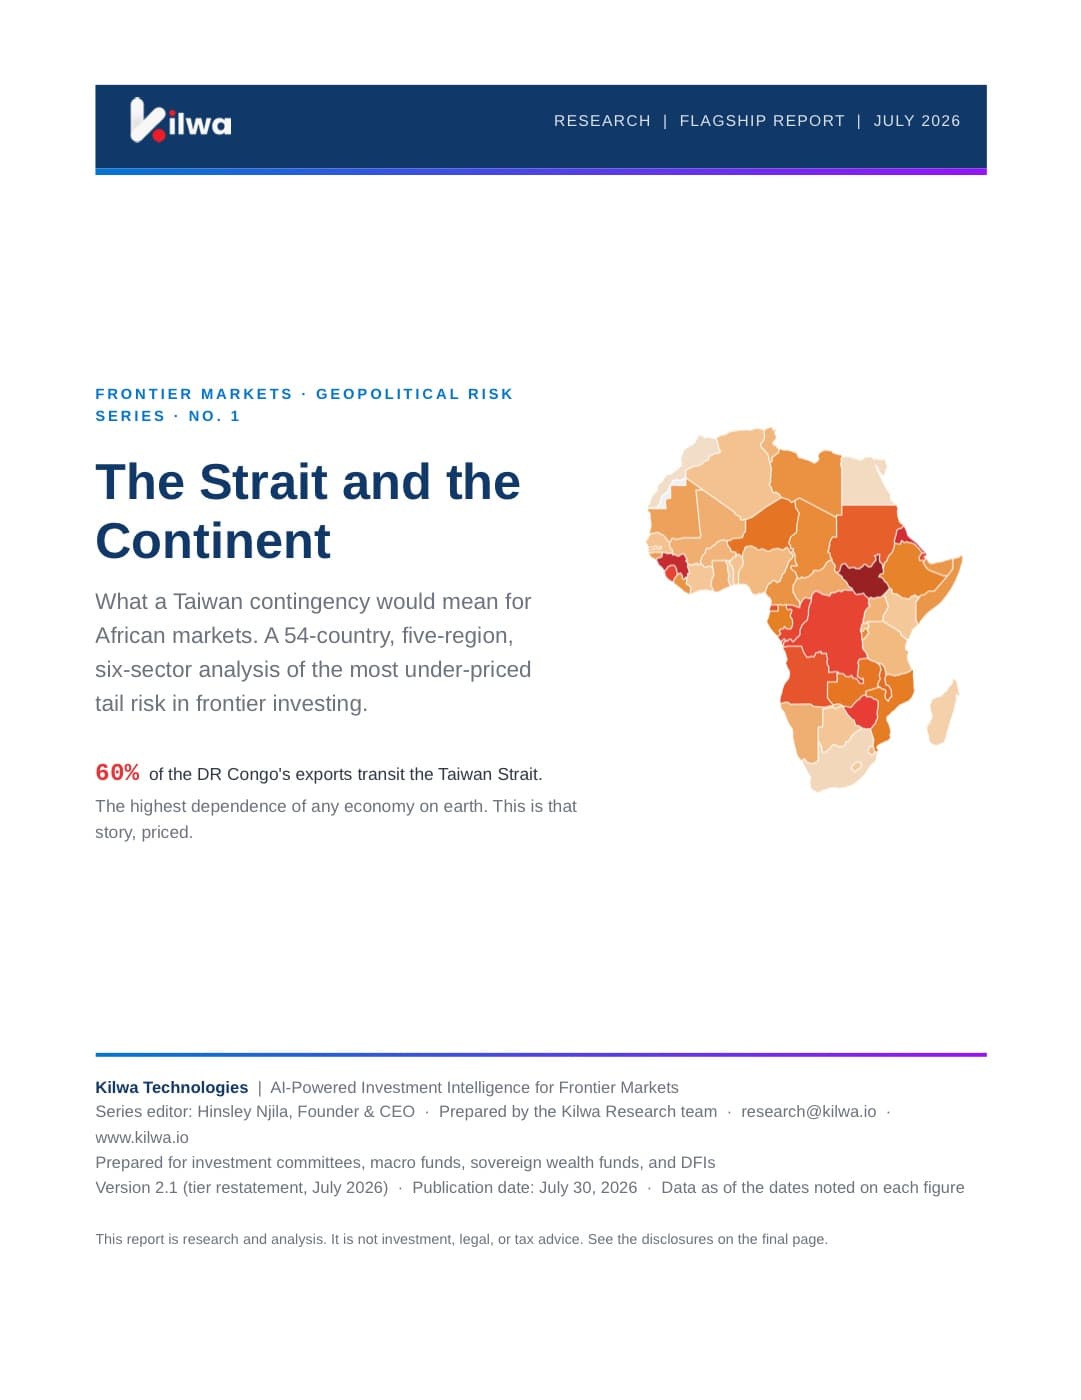

Get started
Built for sovereign wealth.
A working session on the markets you follow, with the decomposition behind every score.