Energy Signal · No. 1
African Energy 2026
The strongest signal is not the market the room expects.
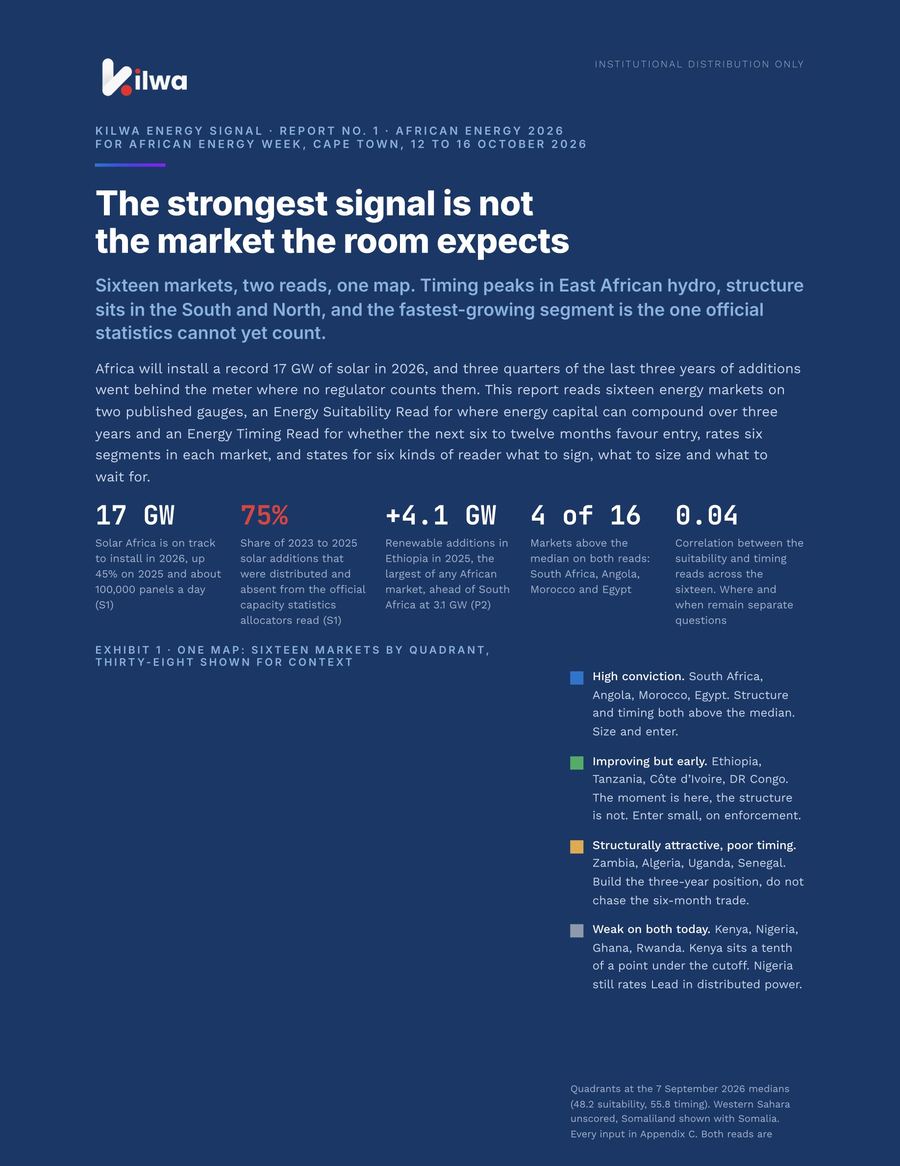
Sixteen energy markets read on two published gauges: a suitability read for where energy capital can compound over three years and a timing read for whether the next six to twelve months favour entry. Timing peaks in East African hydro, structure sits in the South and North, four markets clear both bars, and the fastest-growing segment is the one official statistics cannot yet count. Published ahead of African Energy Week, Cape Town, 12 to 16 October 2026.
Series editor Hinsley Njila, Founder & CEO · Prepared by the Kilwa Research team
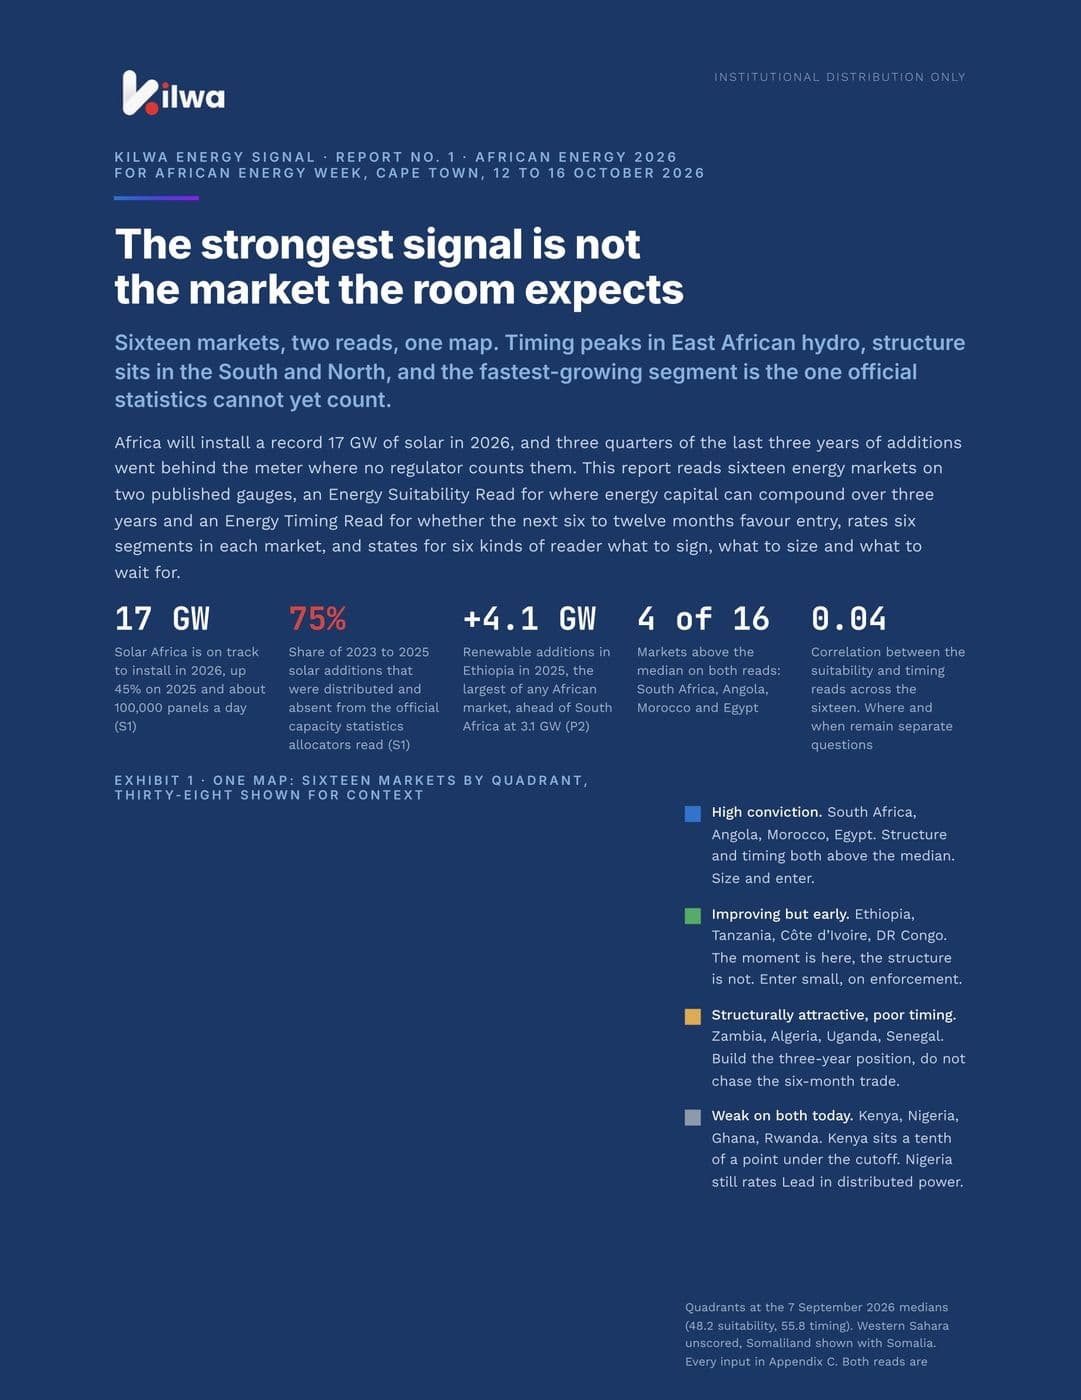
of Africa's 2023 to 2025 solar additions were distributed: behind the meter, and absent from the official capacity statistics that most allocation models read
Key takeaways
- 01
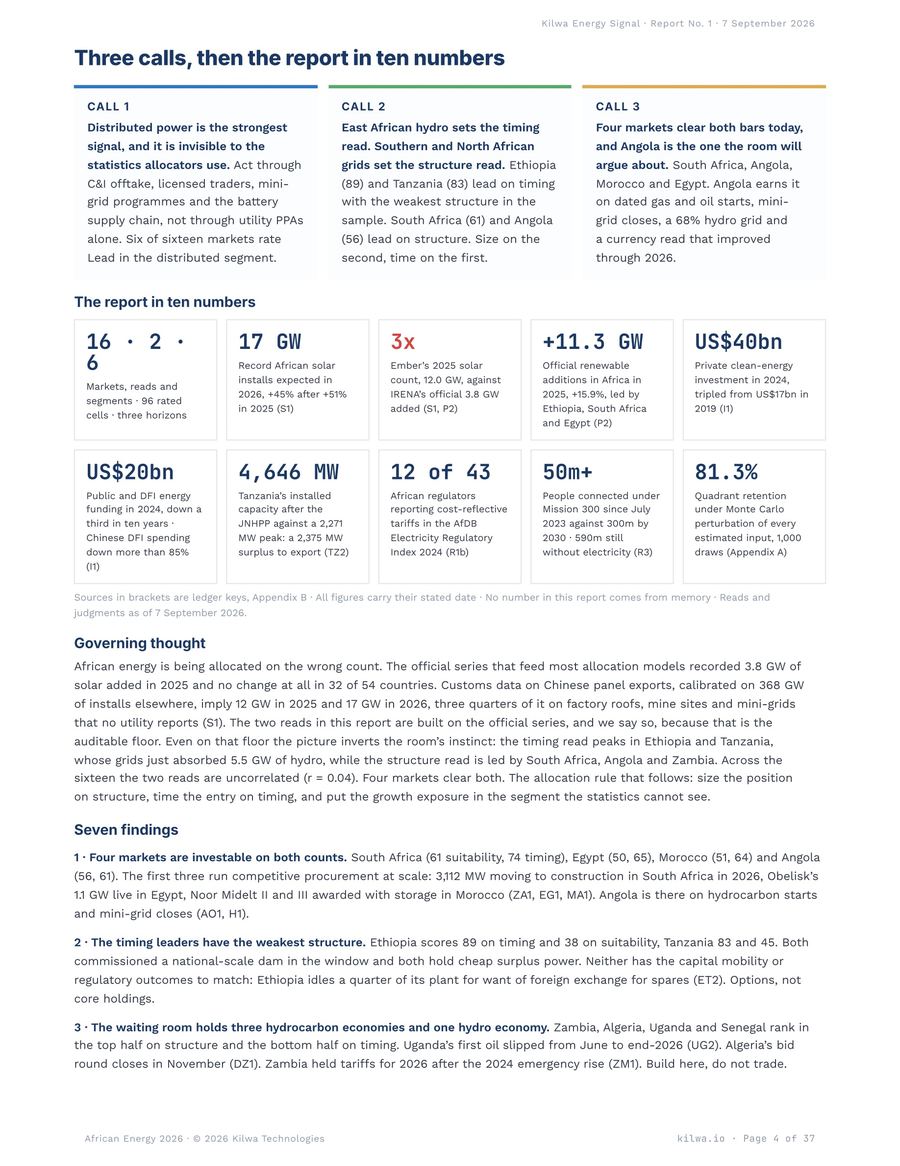
Distributed power is the strongest signal, and it is invisible to the statistics allocators use. Of 26 GW of solar added from 2023 to 2025, about 20 GW went behind the meter, and six of sixteen markets rate Lead in the distributed segment.
- 02
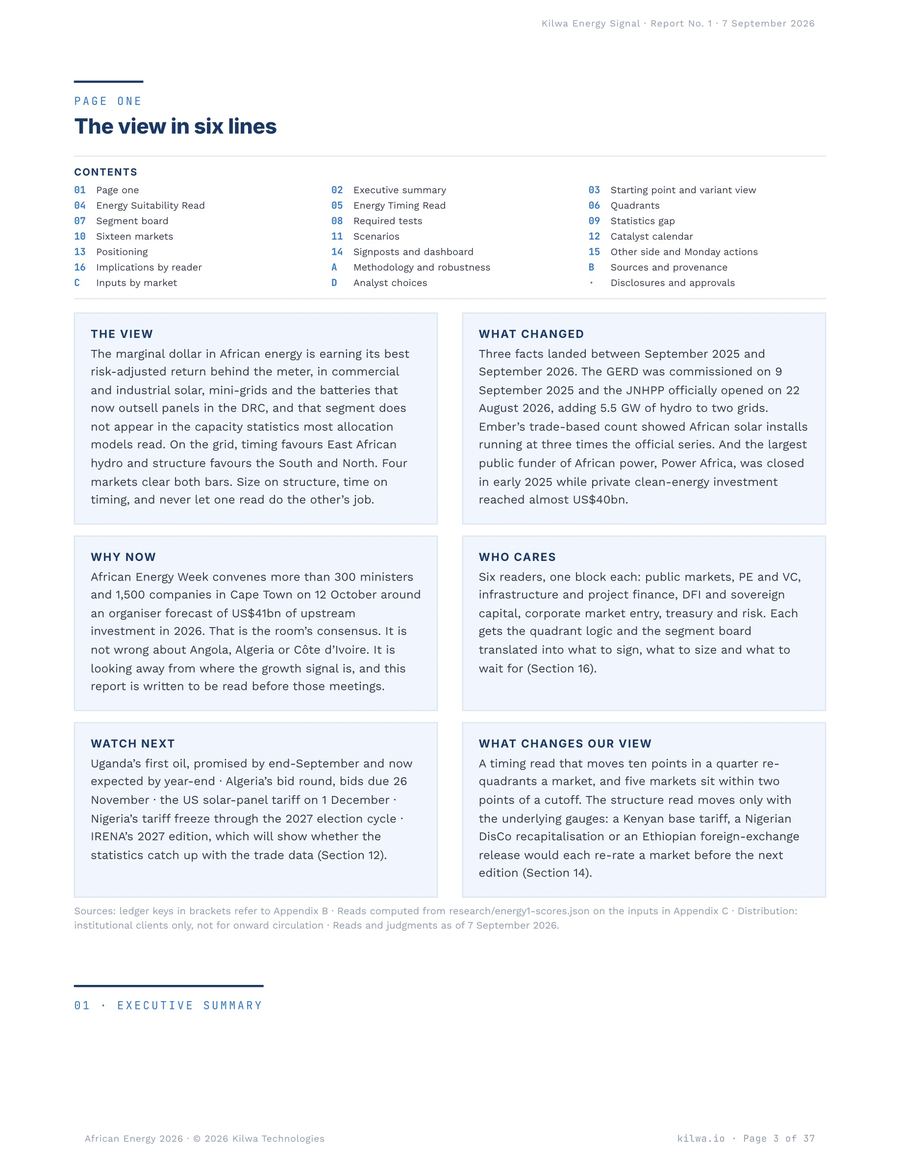
East African hydro sets the timing read; Southern and North African grids set the structure read. Ethiopia (89) and Tanzania (83) lead on timing with the weakest structure in the sample, while South Africa (61) and Angola (56) lead on structure.
- 03
Four markets clear both bars: South Africa (61 suitability, 74 timing), Egypt (50, 65), Morocco (51, 64) and Angola (56, 61). Angola is the one the room will argue about, and it earns its place on dated gas and oil starts, mini-grid closes, a 68% hydro grid and a currency read that improved through 2026.
- 04
Nigeria and Kenya fail both bars on the official count and lead the distributed segment anyway. Nigeria's official solar additions in 2025 were 51 MW against a trade-based estimate of 1.7 GW for 2026; Kenya sits a tenth of a point under the suitability median.
- 05
The segment board rewards the meter over the wellhead. Of 96 country-segment cells, 17 are Lead and one is Avoid: Kenyan thermal at US$0.23 per kWh, displaced by Ethiopian imports at US$0.066.
- 06
The reads are stable enough to act on and honest about what they are. The timing read reproduces at 0.98 or better under three alternative weightings, and 75 of 144 inputs (52.1%) are verified from a cited primary series. Both reads are structured rankings, not validated predictive models, and neither is ISI or METI.
The report, in brief
What it is, who it is for, and what you get.
Sixteen African energy markets read on suitability and timing, with six segments rated market by market.
Written for
Energy and infrastructure investors
Where to size on structure and where to time entry: four markets clear both bars today.
IPPs, developers and equipment makers
Which of 96 market-segment cells are rated Lead, and which procurement rounds have actually cleared.
DFIs and climate funds
Where distributed solar, 75% of 2023 to 2025 additions, is growing outside the official series.
Oil, gas and services companies
What bid rounds, first oil and tariff decisions mean for entry, market by market.
What you get
- Suitability and timing reads for sixteen markets, with quadrant membership
- A 96-cell map: six segments across sixteen markets, each cell rated
- Three calls, seven findings and the variant view against consensus
- Four scenarios, nineteen dated events and ten signposts graded in public
- Method, weights, verified and estimate flags, and the Monte Carlo test
- 37 pages as a PDF, delivered the moment payment clears
The call
Put the growth exposure behind the meter, where the statistics are not. Size the position on structure: South Africa, Angola, Morocco and Egypt clear both bars today. Time the entry on timing: Ethiopia and Tanzania lead the timing read on two commissioned dams and are options sized to their capital-mobility risk, not core holdings. Build the three-year book in Zambia, Algeria, Uganda and Senegal. Treat Nigeria and Kenya as segment trades, not country trades. Expect the official series to catch up in 2027 and the reads to move with them.
Two reads, four quadrants, six segments, three horizons
Where energy capital can compound and whether now is the moment are different questions with different evidence. The Energy Suitability Read answers the first from five structural factors: system scale and paying demand, demand runway, regulatory quality and execution, capital mobility, and endowment in use. The Energy Timing Read answers the second from four cyclical ones: currency pressure, capacity momentum, the live pipeline and tariff direction. Every factor is a published series or a published rubric, every weight is stated, and every input carries a flag that says whether it is reproducible from a cited primary source or derived, inherited or judged.
Quadrants split at the sixteen-market medians, 48.2 on suitability and 55.8 on timing, so they describe a market's position relative to the sample on 7 September 2026, not an absolute grade. Six segments are rated in each market on published evidence and marked Watch where evidence is missing: utility-scale renewables and storage, gas-to-power and thermal, grid and services, distributed and off-grid, upstream, and midstream, LNG and refining. Six months is the timing read plus the catalyst calendar; twelve months adds tariff direction; three years is the suitability read.
“Size the position on structure, time the entry on timing, and never let one read do the other's job.”
The variant view: the room is counting the wrong thing
African Energy Week convenes more than 300 ministers and 1,500 companies in Cape Town around an organiser forecast of US$41bn of upstream investment in 2026. That is the room's consensus, and it is not wrong about Angola, Algeria or Côte d'Ivoire. It is looking away from where the growth signal is. The official series that feed most allocation models recorded 3.8 GW of solar added in 2025 and no change at all in 32 of 54 countries. Customs data on Chinese panel exports, calibrated on 368 GW of installs elsewhere, imply 12 GW in 2025 and 17 GW in 2026, three quarters of it on factory roofs, mine sites and mini-grids that no utility reports.
The money moved before the statistics did. Private clean-energy investment in Africa tripled from about US$17bn in 2019 to almost US$40bn in 2024, while public and DFI energy funding fell by a third in ten years to US$20bn and Chinese development-finance spending fell more than 85%. Power Africa closed in early 2025. Mission 300 is the public replacement and it is real, with more than 50 million people connected since July 2023, but its own arithmetic needs about 50 million connections a year to reach 300 million by 2030. The gap will be filled behind the meter or not at all. The two reads are built on the official series on purpose, because that is the auditable floor, and the report measures the gap beside them rather than hiding it inside a score.
“An allocator reading the official series sees Nigeria adding 51 MW. The ports saw enough panels for 1.7 GW. The gap is the opportunity, and it is also the model risk.”
Seven ways the reads could fool us, each measured
Scale carries the structure read, and the report publishes the ranking without it: removing the system-scale factor drops the rank correlation to 0.244 and puts Uganda first, on the strength of the best-run regulator in the AfDB index. Scale stays at 20% because a project developer, a lender and a corporate buyer all face a market whose size bounds what they can build, and the alternative is printed so a reader who disagrees can use it. Fuel exporters do not score better on timing despite the Brent rally, so the oil price is not flattering the read, and better-measured markets do not score higher.
The timing read reproduces at 0.98 or better under equal, momentum-heavy and currency-heavy weightings, with the same top five each time. Monte Carlo on every estimated input, ±10 points over 1,000 draws, keeps 81.3% of quadrant assignments; the five markets within two points of a cutoff are named, with their retention published market by market. Every analyst choice, twelve in all, is stated in an appendix with its basis and its effect if wrong.
Four paths to the Q1 2027 revision
Probabilities are Kilwa's subjective judgments as of the publication date, not measured frequencies and not forecasts of returns. Each scenario is anchored to a documented episode and names the segments it moves.
- 01Base · additions outrun statistics · 55%The 17 GW trade-based estimate lands within ±3 GW, IRENA's 2027 edition revises 2025 to 2026 solar up by 3 to 6 GW, indexed tariffs hold in Egypt, Ghana and Ethiopia, and Brent sits at US$75 to 90. Distributed wins in Nigeria, DR Congo, Zambia, South Africa, Angola and Rwanda; grid in Kenya and Tanzania; upstream in Angola, Côte d'Ivoire and Algeria.
- 02Upside · grids catch up · 15%South Africa's wholesale market launches, Kenya gazettes a base tariff, Nigeria clears DisCo arrears after the election and Uganda exports first oil by Q1 2027: three markets gain 8 to 15 timing points. Utility-scale wins in South Africa and Kenya; gas-to-power in Uganda and Nigeria; midstream in Uganda and Tanzania.
- 03Downside · offtaker stress returns · 20%Currency pressure rises in three or more markets, Ethiopia's foreign-exchange shortage idles more plant, Nigeria's tariff freeze lifts the subsidy past ₦400bn a quarter and Zambia has a drought year: timing reads fall 5 to 12 points in Nigeria, Ethiopia and Zambia. Distributed wins everywhere, because grid failure shortens paybacks; dollar PPAs hold in Egypt.
- 04Stress · Hormuz plus panel tariffs · 10%A renewed Strait of Hormuz closure takes Brent above US$110 for a quarter, fuel importers absorb 15 to 30% pass-throughs, and US and EU panel tariffs redirect more Chinese supply to Africa. Upstream and distributed in the importers win; gas-to-power in Egypt and thermal in Kenya and Ghana lose. An escalation clock states the decision each window forces, from day 0 to day 180.
What would change our view
Ten dated signposts, each with Kilwa's expectation, its confidence and what it would mean if wrong: Uganda's first commercial oil by 31 December 2026; IRENA's 2027 edition showing 2026 African solar additions above 8 GW; at least 1,000 MW of South Africa's Bid Window 7 at financial close by 30 June 2027; no Band A tariff increase in Nigeria before the election; a gazetted Kenyan base tariff by 31 March 2027; one more dollar-denominated Egyptian financial close above 1 GW; Kenyan imports from Ethiopia above 1,500 GWh; a Tanzanian export PPA for surplus power; at least four of seven Algerian blocks signed; and a cost-reflective multi-year Zambian tariff for 2027. Every one is graded in public in the Q1 2027 revision, with the expectation, the outcome and the grade printed side by side.
A timing read that moves ten points in a quarter re-quadrants a market, and five markets sit within two points of a cutoff. The structure read moves only with the underlying gauges: a Kenyan base tariff, a Nigerian DisCo recapitalisation or an Ethiopian foreign-exchange release would each re-rate a market before the next edition. Nineteen dated events to end-2027 and a ten-indicator monitoring dashboard, listed in the order the indicators would move, are published with the report.
What this report is not
Not an ISI or METI output: both indices remain in independent validation and no validated score appears. Not a return forecast, a rating or a recommendation to any recipient: the frameworks are for sizing conversations and are tailored to no portfolio. Not a census of projects: the segment board covers sixteen markets and six segments on published evidence and says Watch where evidence is missing. Disclosure: a member of Kilwa's advisory council holds a senior role at the African Energy Chamber, the organiser of African Energy Week, for which this report is published. Kilwa and its personnel hold no positions in, and received no compensation from, any issuer, government or agency named in the report as of the publication date.
The numbers
- 17 GW
- of solar Africa is on track to install in 2026, up 45% on 2025, on a trade-based count that runs at three times the official series
- 4 of 16
- markets above the median on both reads: South Africa, Angola, Morocco and Egypt. Size on structure, time on timing
- 0.04
- correlation between the suitability read and the timing read across the sixteen: where and when remain separate questions
- 81.3%
- of quadrant assignments that survive Monte Carlo perturbation of every estimated input, over 1,000 draws
The model, in one table
The four quadrants
| Quadrant | Markets | What it means for capital |
|---|---|---|
| High conviction | South Africa (61 · 74), Angola (56 · 61), Morocco (51 · 64), Egypt (50 · 65) | Both reads above the median. Sign the procurement that already cleared: Bid Window 7 and the battery closes in South Africa, Egyptian dollar PPAs, Noor Midelt, Angolan mini-grid programmes. Core holdings, sized on structure. |
| Improving but early | Ethiopia (38 · 89), Tanzania (45 · 83), Côte d'Ivoire (46 · 59), DR Congo (45 · 56) | Timing above, structure below. Export and evacuation contracts, Baleine services, mining-captive solar. Options, enlarged only on repatriation evidence. |
| Structurally attractive, poor timing | Zambia (55 · 49), Algeria (50 · 49), Uganda (48 · 54), Senegal (48 · 42) | Structure above, timing below. Prepare, do not commit: bid-round data rooms, Zambian open-access counterparties, Ugandan services. First oil, bid-round awards and the Zambian 2027 tariff decide entry. |
| Weak structure, weak timing | Kenya (48 · 48), Nigeria (47 · 51), Ghana (47 · 56), Rwanda (38 · 35) | Segment trades only: Nigerian and Kenyan distributed solar, Kenyan import wheeling. Kenya is 0.1 under the suitability cutoff and Ghana 1.6; nobody should trade on a quadrant boundary. |
Two published reads, 0 to 100, higher is better, split at the sixteen-market medians of 48.2 on suitability and 55.8 on timing as of 7 September 2026. Both reads are structured rankings built from cited series and dated ledger events — not validated predictive models — and neither is ISI or METI, which remain in independent validation. Four markets sit in each quadrant; the figures in brackets are the suitability and timing reads.
By market
Markets this report tiers.
- Algeria
- Angola
- Côte d'Ivoire
- DR Congo
- Egypt
- Ethiopia
- Ghana
- Kenya
- Morocco
- Nigeria
- Rwanda
- Senegal
- South Africa
- Tanzania
- Uganda
- Zambia
Each market page gathers every tier the published reports print for that market, dated and linked to its source.
Series editor: Hinsley Njila, Founder & CEO. Prepared by the Kilwa Research team. research@kilwa.io
This report is research and analysis. It is not investment, legal or tax advice. Kilwa scores are structured risk rankings, not validated predictive models, except where explicitly stated otherwise. It is prepared for general circulation on a published schedule and is not tailored to any recipient.
Conflicts of interest. Kilwa does not hold, trade or take positions in the securities, currencies or instruments of the markets it scores, and receives no compensation from any government, issuer or institution in exchange for a score, a rating or favourable coverage. Where a research programme is funded by a named partner, that funding is disclosed in the report.