Special Briefing · US Midterms 2026
The Heartland Sent the Bill: Tariffs, Oil and Prices Flipped Congress
Why the Midwest flipped Congress on November 3, 2026, what tariffs, oil and prices did to the farm gate, and what a Democratic Congress means for US-Africa trade.
On November 3, 2026 the Midwest swung a median 12 points toward Democrats and delivered the Senate. Kilwa Research traces the 2026 midterm results in the Midwest to the 2025 tariff regime, the Iran war fuel spike and the grocery bill, then follows the displaced US trade to Africa, where Egypt became the fourth-largest buyer of US soybeans in 2025 and South Africa faces an AGOA termination on January 1, 2027.
Series editor Hinsley Njila, Founder & CEO · Prepared by the Kilwa Research team
 Special briefing
Special Briefing · US Midterms 2026
The Heartland Sent the Bill: Tariffs, Oil and Prices Flipped Congress
Why the Midwest flipped Congress on November 3, 2026, what tariffs, oil and prices did to the farm gate, and what a Democratic Congress means for US-Africa trade.
4 November 2026 · 12 Midwest states · 54 African markets · 5 lanes
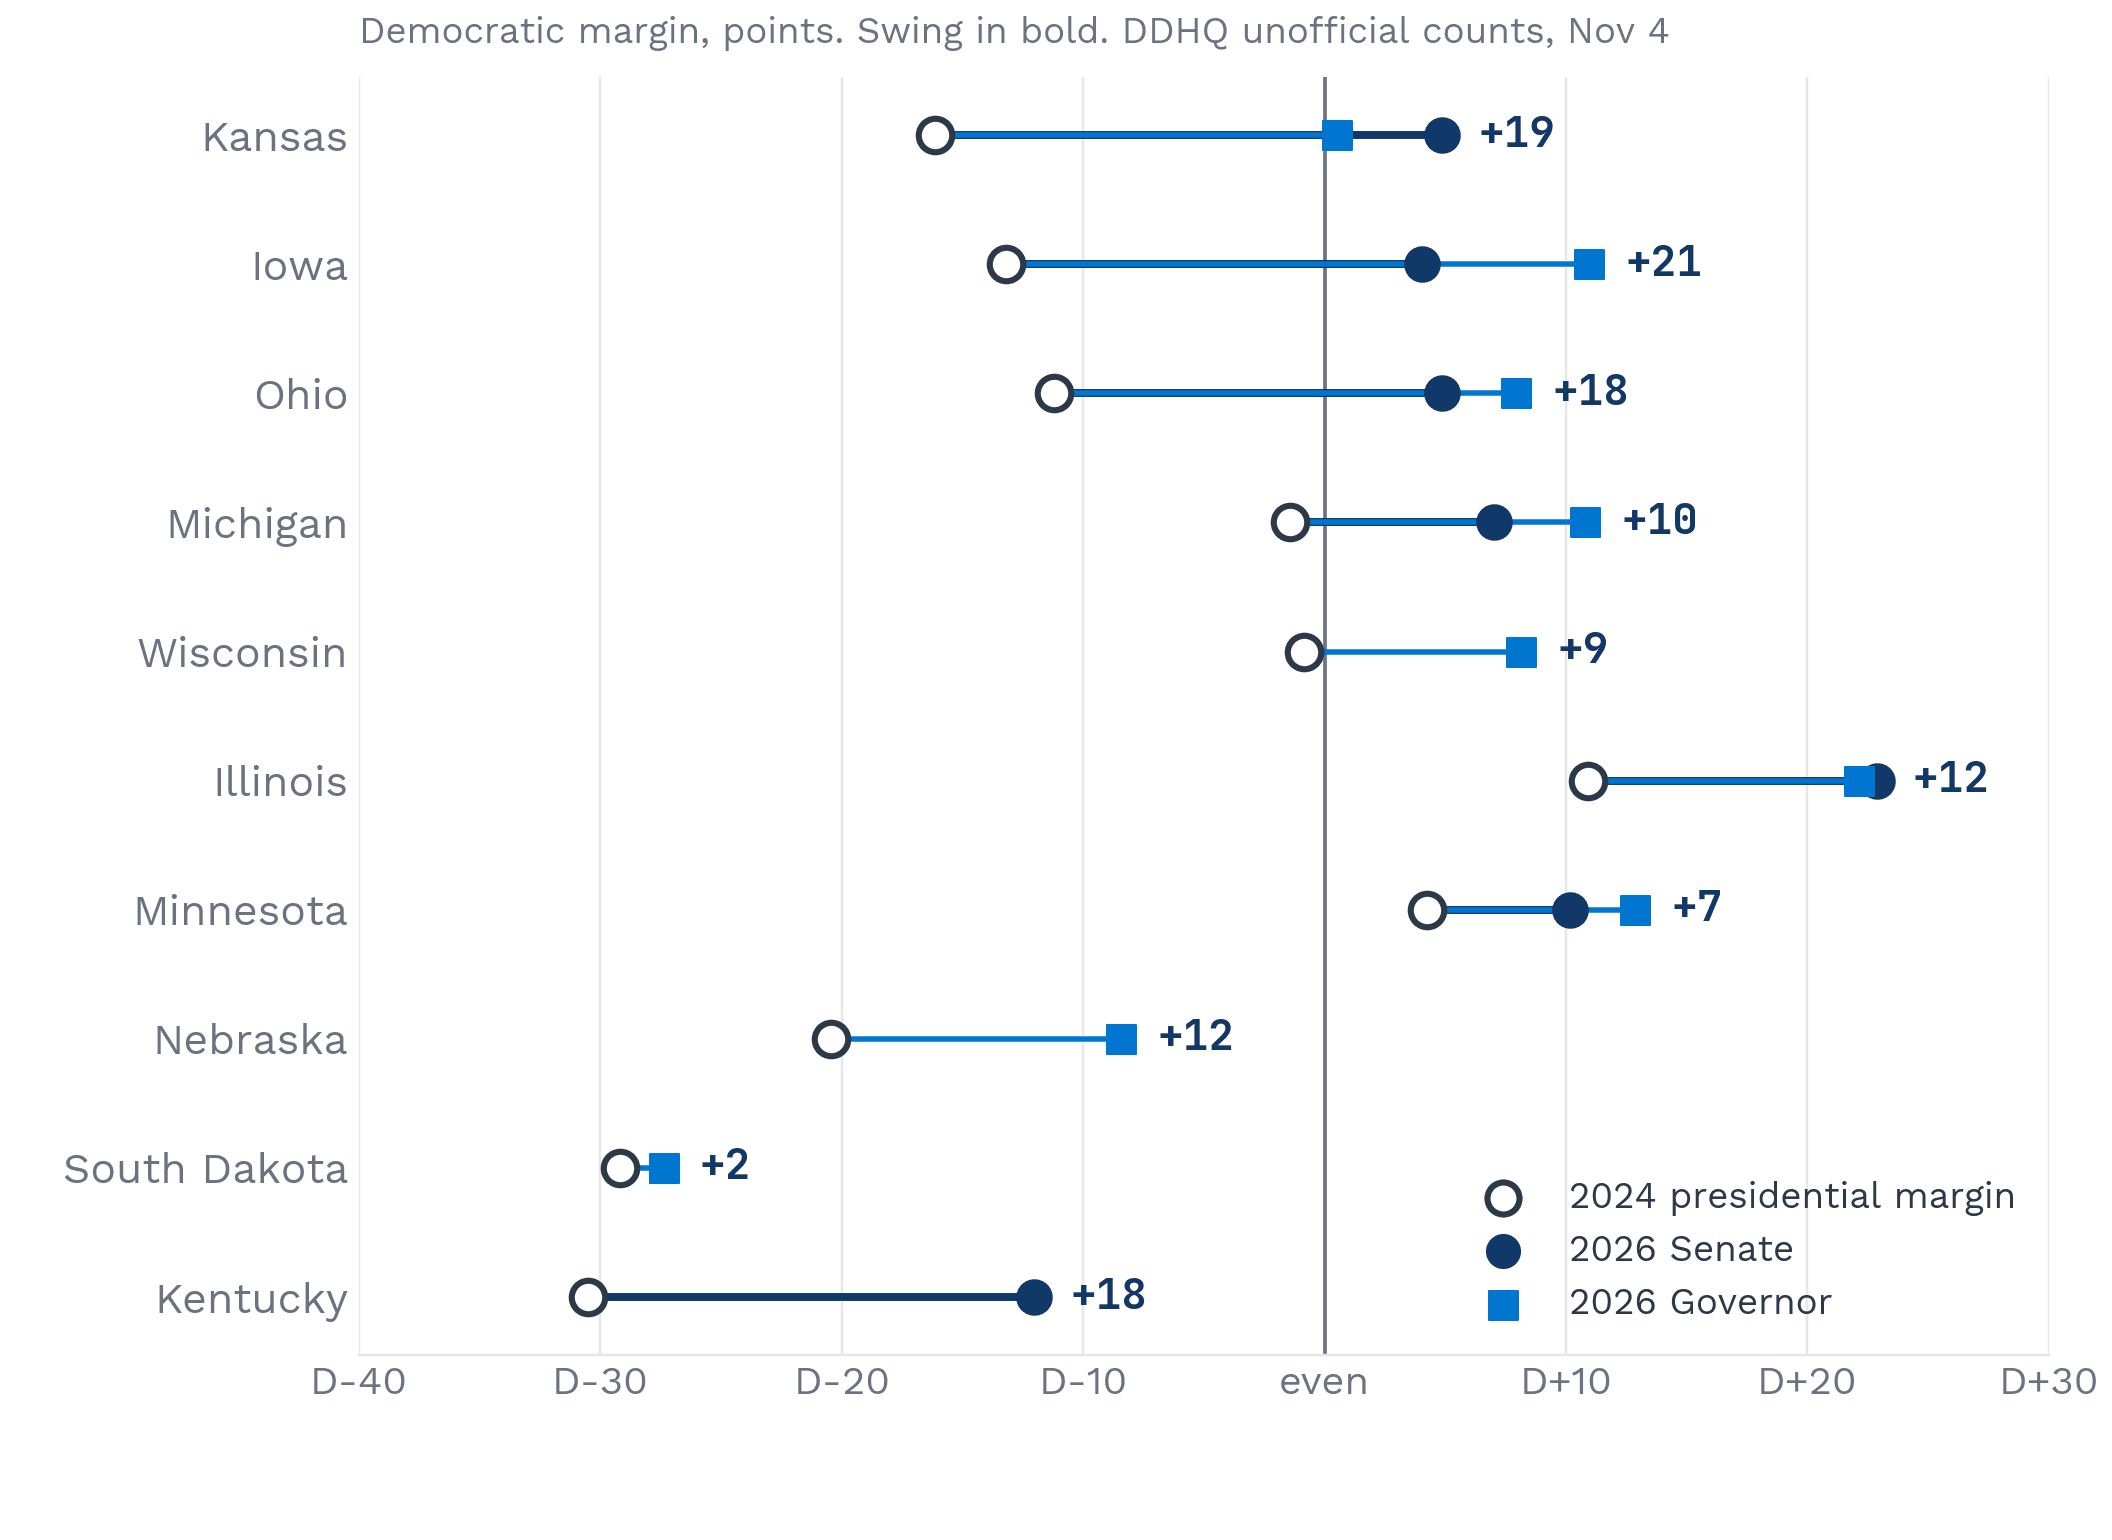
Median swing toward Democrats across ten Midwest Senate and governor races on November 3, 2026, measured against the 2024 presidential margin. Kansas moved 19 points, Iowa 21 and Ohio 18.
Key takeaways
- 01
The Midwest swung as one. Ten Senate and governor races moved a median 12 points toward Democrats against 2024, Kansas 19, Iowa 21 and Ohio 18, and county margins tracked 2024 with an R² of 0.99. A wave, not a rural revolt.
- 02
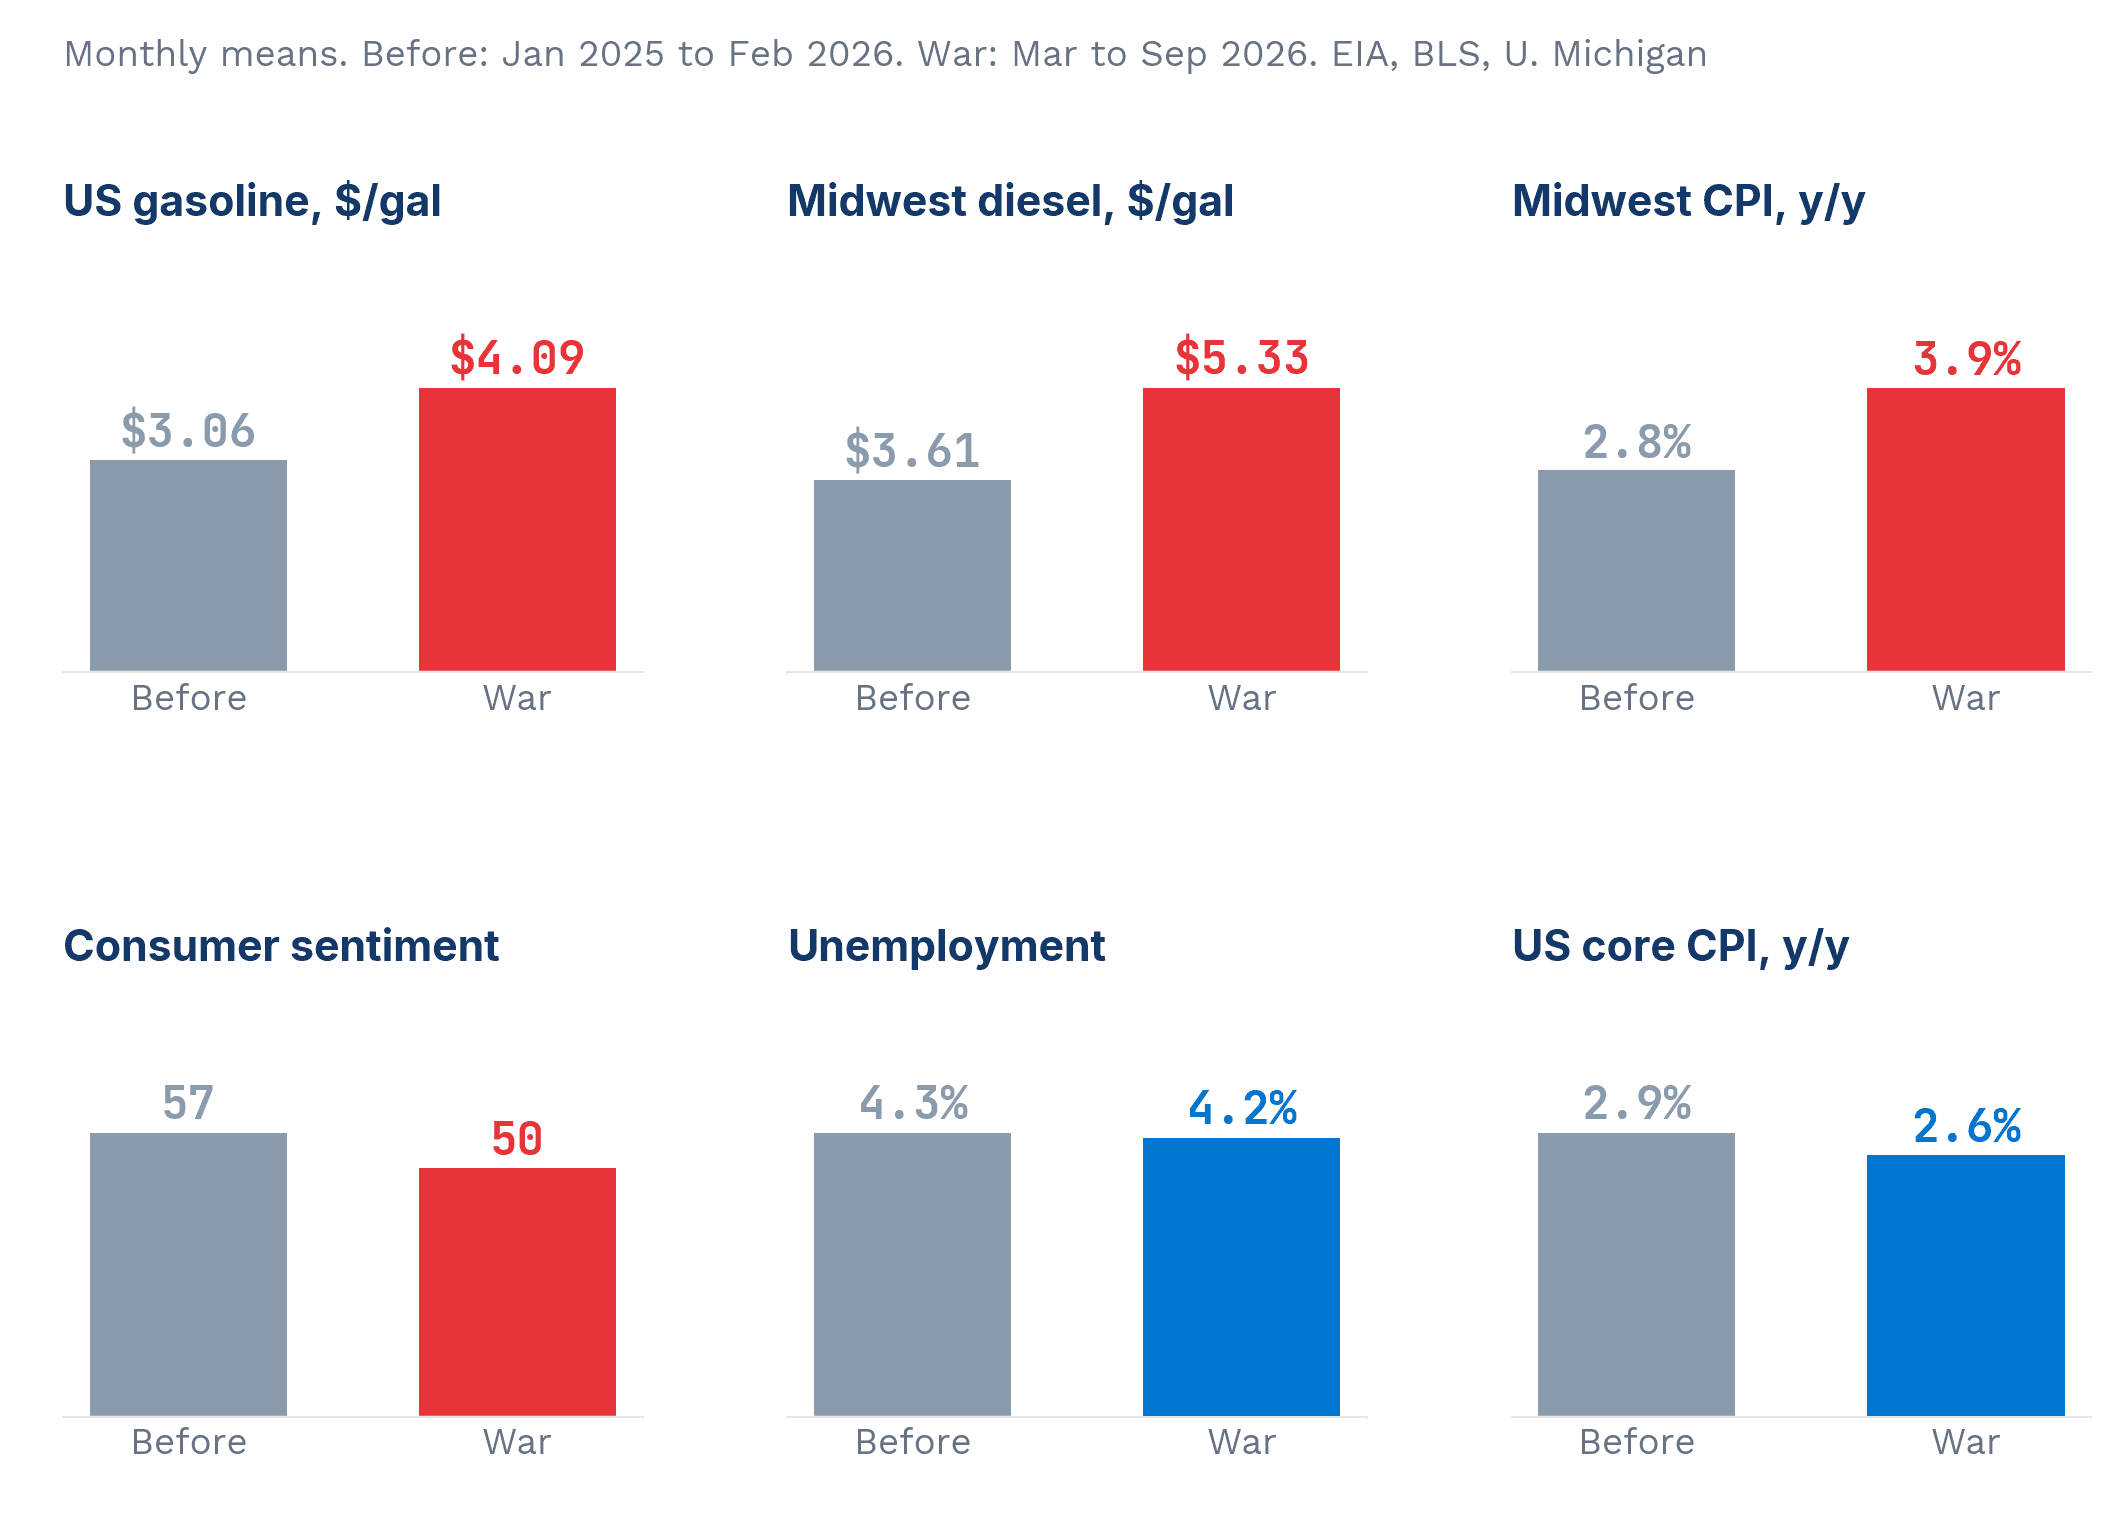
It was a price shock, not a jobs shock, and the war delivered it. Gasoline rose US$1.03 and Midwest diesel US$1.72 in the war months, Midwest inflation went from 2.8% to 3.9%, consumer sentiment fell seven points, and unemployment held at 4.2%.
- 03
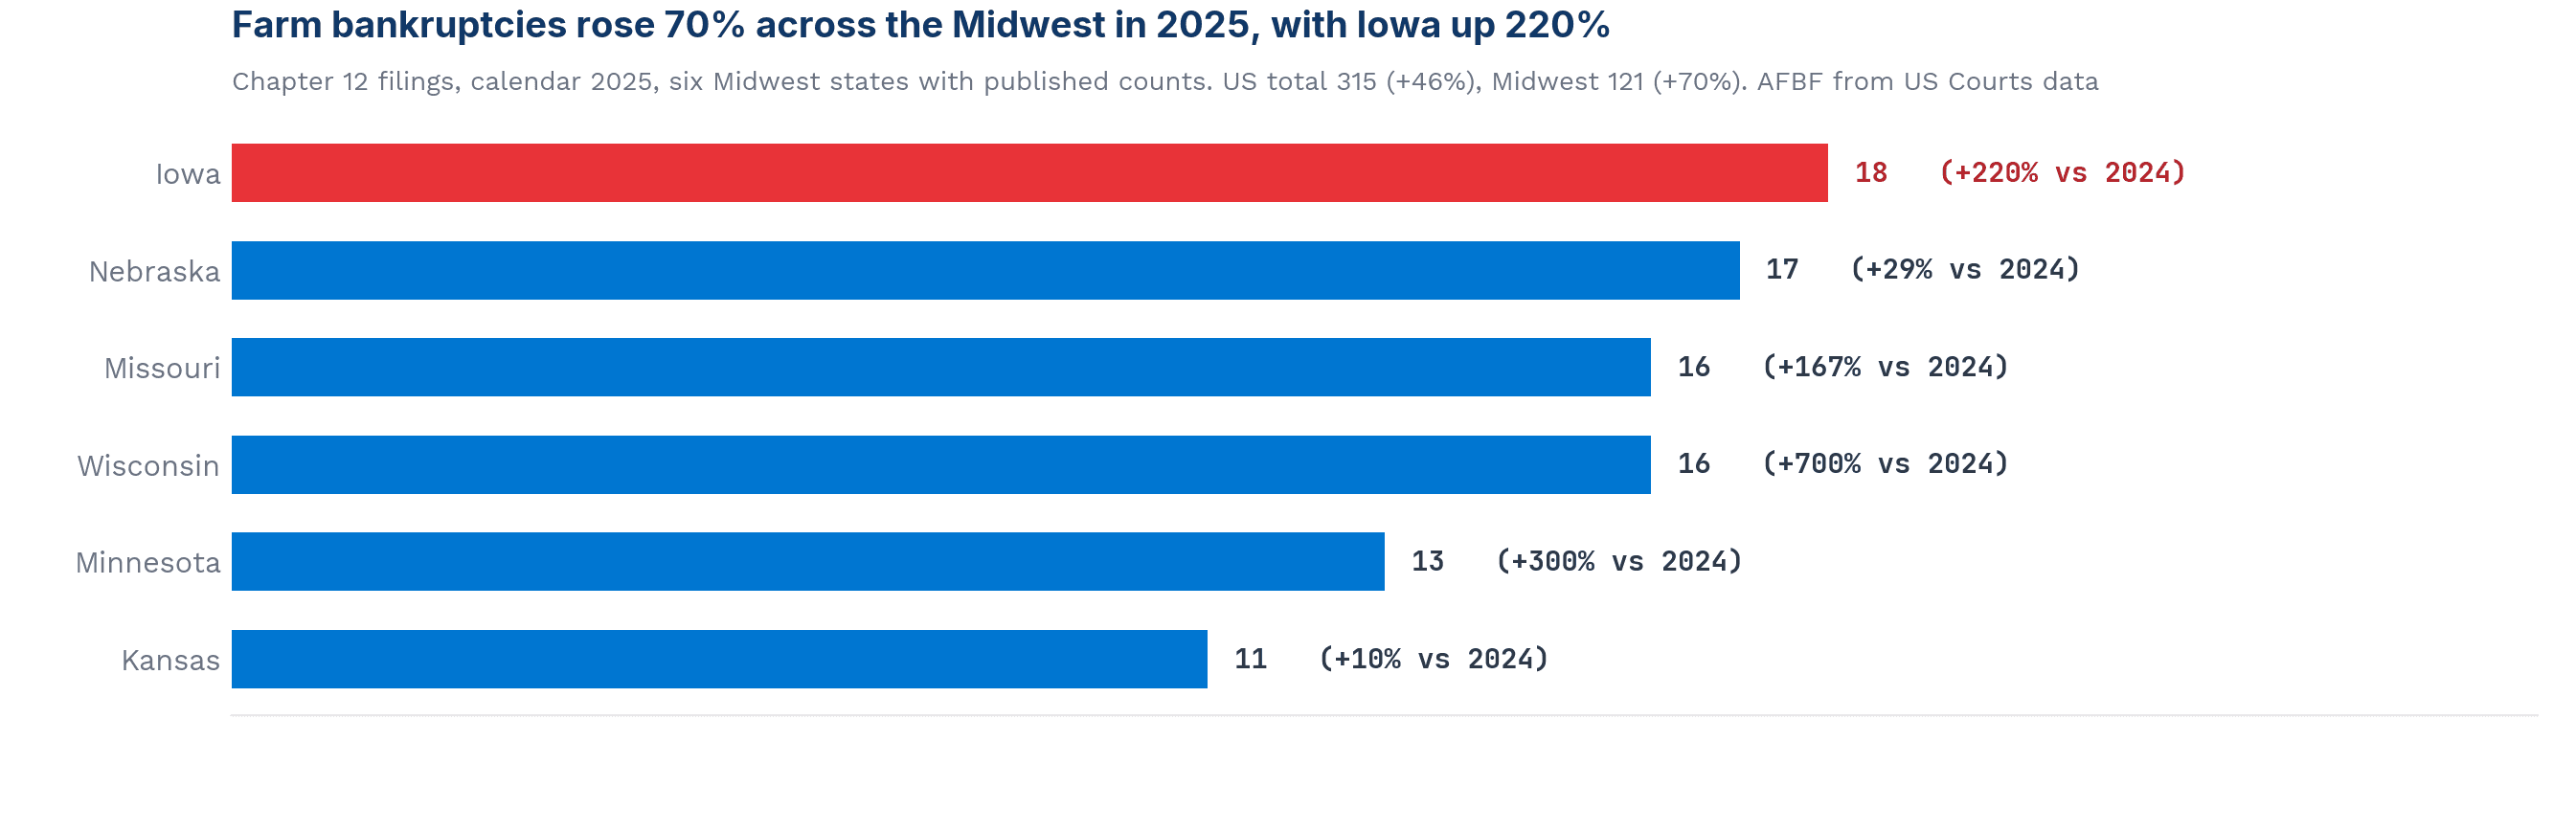
The farm gate paid first. US farm exports to China fell US$16bn in 2025, Midwest Chapter 12 bankruptcies rose 70%, and 70% of farmers told the Farm Bureau in April they could not afford all the fertilizer they needed after Hormuz closed.
- 04
Africa caught under 1% of the overflow and grew anyway. Midwest soybeans to Africa hit a record US$436m, Egypt became the fourth-largest buyer of US soybeans, and Midwest-12 exports to Africa rose 7.3% to US$4.80bn while the total stood still.
- 05
The comps run the other way. China runs four times the US-Africa trade and charges zero tariffs for 53 African countries, and Washington gave notice to drop South Africa, half of AGOA trade, the day before the vote.
- 06
Ten days in January decide the corridor: South Africa out of AGOA on the 1st, the new Congress on the 3rd, the China truce expiring on the 10th. Base case 55%, and two of the eight signposts are already breached.
The call
Africa is the relief valve that works, not a replacement for China. Midwest exports to Africa grew 7.3% under the tariff regime while the Midwest total stood still, the lane the first trade war opened in 2018 never closed, and the ten days after New Year decide whether US access to the corridor widens or narrows. Position for the window, and size it honestly.
The Midwest swung as one
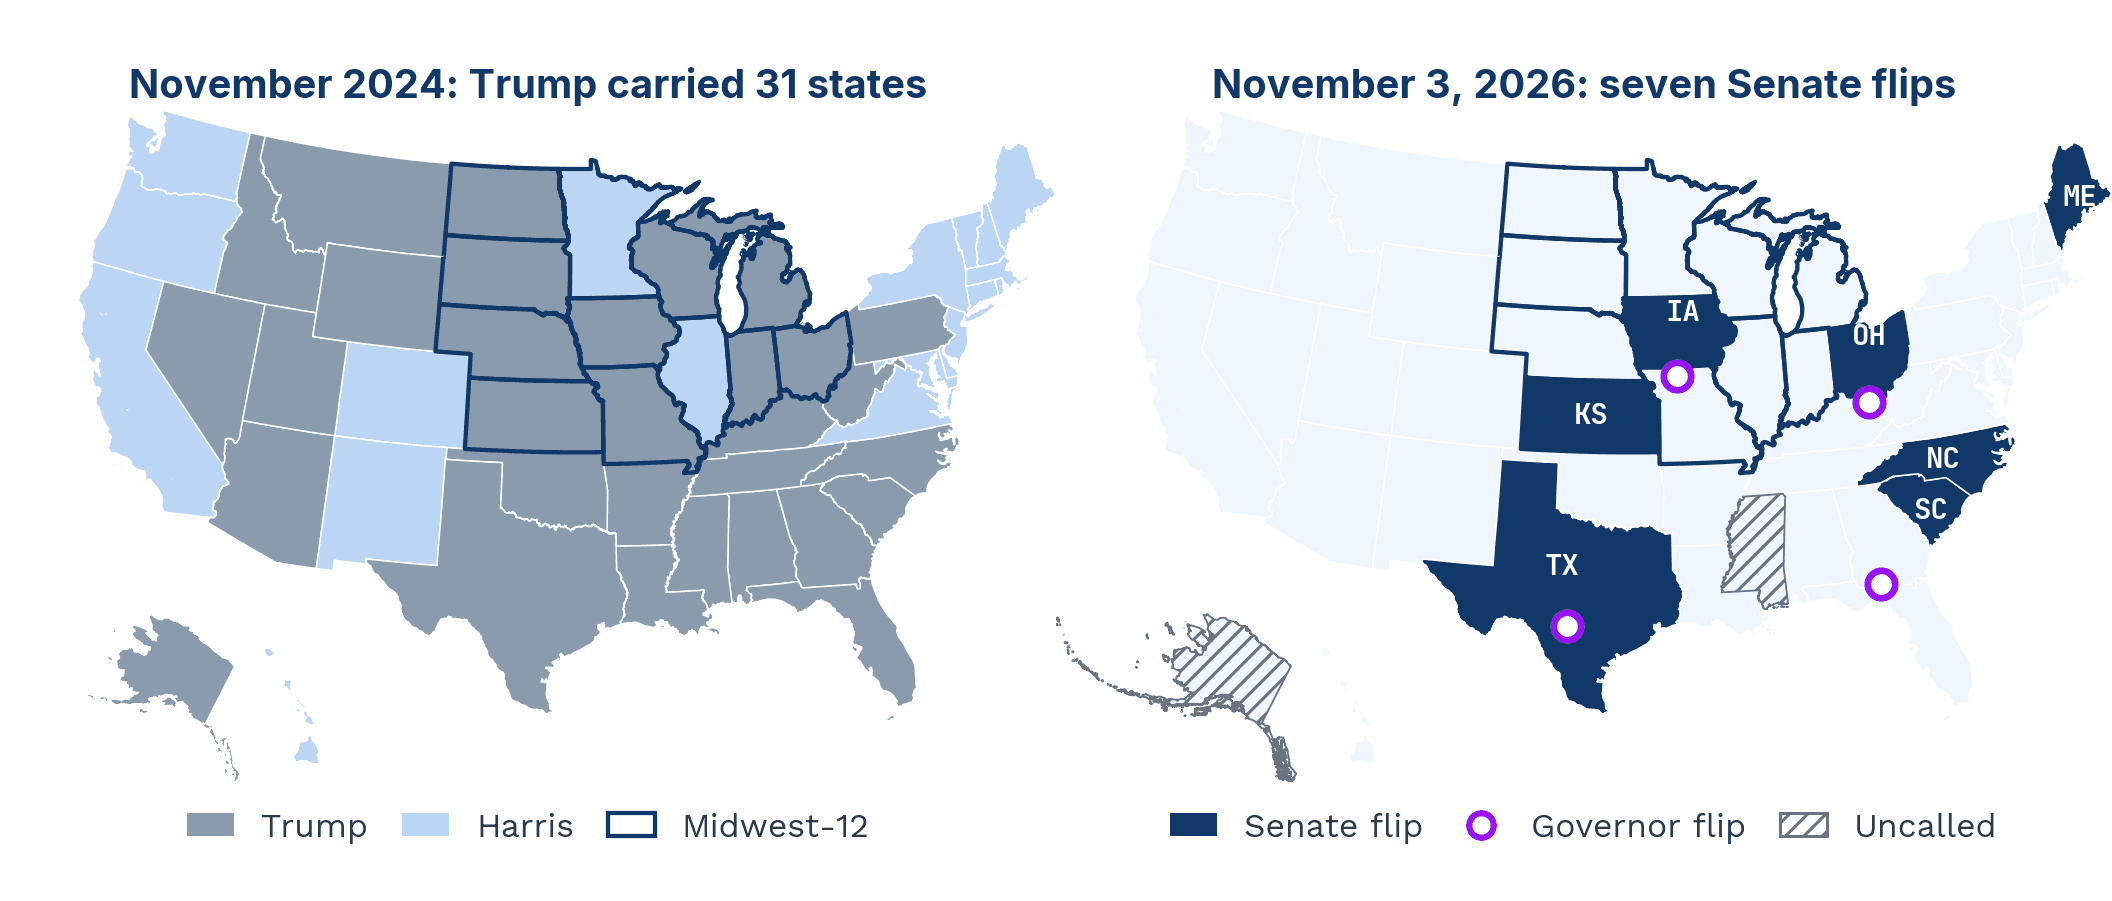
Before the election the Senate stood at 53 Republicans to 47 Democrats. After November 3 it stands at 54 Democrats to 44 Republicans with Alaska and Mississippi uncalled. Seven seats flipped, six of them in states Trump carried in 2024: North Carolina, Texas, Kansas, Ohio, Iowa, South Carolina and Maine. Governors moved to a Democratic majority for the first time since 2010 as Iowa, Ohio, Texas and Georgia changed hands. The Midwest supplied three of the seven Senate flips and two of the four governor flips.
Measured against the 2024 presidential margin, the ten Midwest Senate and governor races swung a median 12 points toward Democrats. Kansas moved 19 points, Iowa 21 and Ohio 18. Even Kentucky, which Democrats lost by 12, moved 18 points. In the 25 Iowa and 25 Ohio counties with results, the 2026 margins track the 2024 margins with a slope of 0.95 to 0.96 and an R² of 0.99: the vote-weighted average county moved 17 points in Iowa and 14 in Ohio, individual counties between 11 and 25. A wave, not a rural revolt.
The House result sits inside the historical base rate. Presidential approval alone, across the 22 midterms from 1938 to 2022, predicts a loss of about 37 House seats at 38% approval. A Senate loss of seven or more seats had a 35% chance on the same model. The surprise is the map: the Senate was lost in the Trump column.
A price shock, not a jobs shock
The war delivered the second blow. US and Israeli strikes on Iran began on February 28, 2026, Iran closed the Strait of Hormuz, and the United States blockaded Iranian ports from April 13. Compare the monthly means before the war, January 2025 to February 2026, with the war months, March to September 2026: gasoline rose US$1.03 to an average of US$4.09 a gallon, Midwest diesel rose US$1.72 to US$5.33, Midwest consumer prices went from 2.8% to 3.9% a year, and consumer sentiment fell from 57 to 50 (p = 0.002). Unemployment did not move, 4.3% to 4.2%, and core inflation eased.
Gasoline hit a record US$4.15 on Election Day and Midwest diesel US$6.35 in September. In a regression from January 2025 to September 2026, each US$1 on a gallon of gasoline cost 6.8 points of consumer sentiment, and fuel prices explain about a third of the swing in sentiment. Three in four voters said tariffs had raised their prices, and 73% told Pew they were extremely or very concerned about fuel prices. Presidential approval fell in two steps, from 52% in January 2025 to 43% through the tariff year, then to a floor of 36% after the war began. In the exit polls it stood at 38%, on pace for the lowest for any president in a midterm.
The flipped states had jobs. Iowa, Kansas and Ohio all had unemployment near 4%. What they lacked was price relief.
The farm gate paid first, the assembly line second
The 2025 tariff regime made the Corn Belt contestable before a single missile flew. US farm exports to China fell from US$24.4bn to US$8.4bn in 2025, a US$16bn hole, as Beijing bought Brazilian beans. Midwest Chapter 12 farm bankruptcies rose 70% in the year, with Iowa up 220%. Washington announced US$20bn of farm aid this cycle, US$12bn paid by February 2026 and US$8bn more announced on October 19, against US$23bn in the first trade war. The American Soybean Association put the loss on the 2025 soybean crop at US$75 an acre after the bridge payment.
Then the war landed on farms that had already lost China. Urea at New Orleans was up 49% six weeks into the Hormuz closure, 70% of the farmers surveyed by the Farm Bureau in April said they could not afford all the fertilizer they needed, and diesel persisted through harvest and set a record in September. Auto country paid twice, at the plant and at the dealer: the Midwest Economic Policy Institute modeled 41,700 Midwest manufacturing jobs lost to tariff costs, and GM alone paid more than US$3bn in tariffs in 2025.
Africa caught the overflow and grew anyway
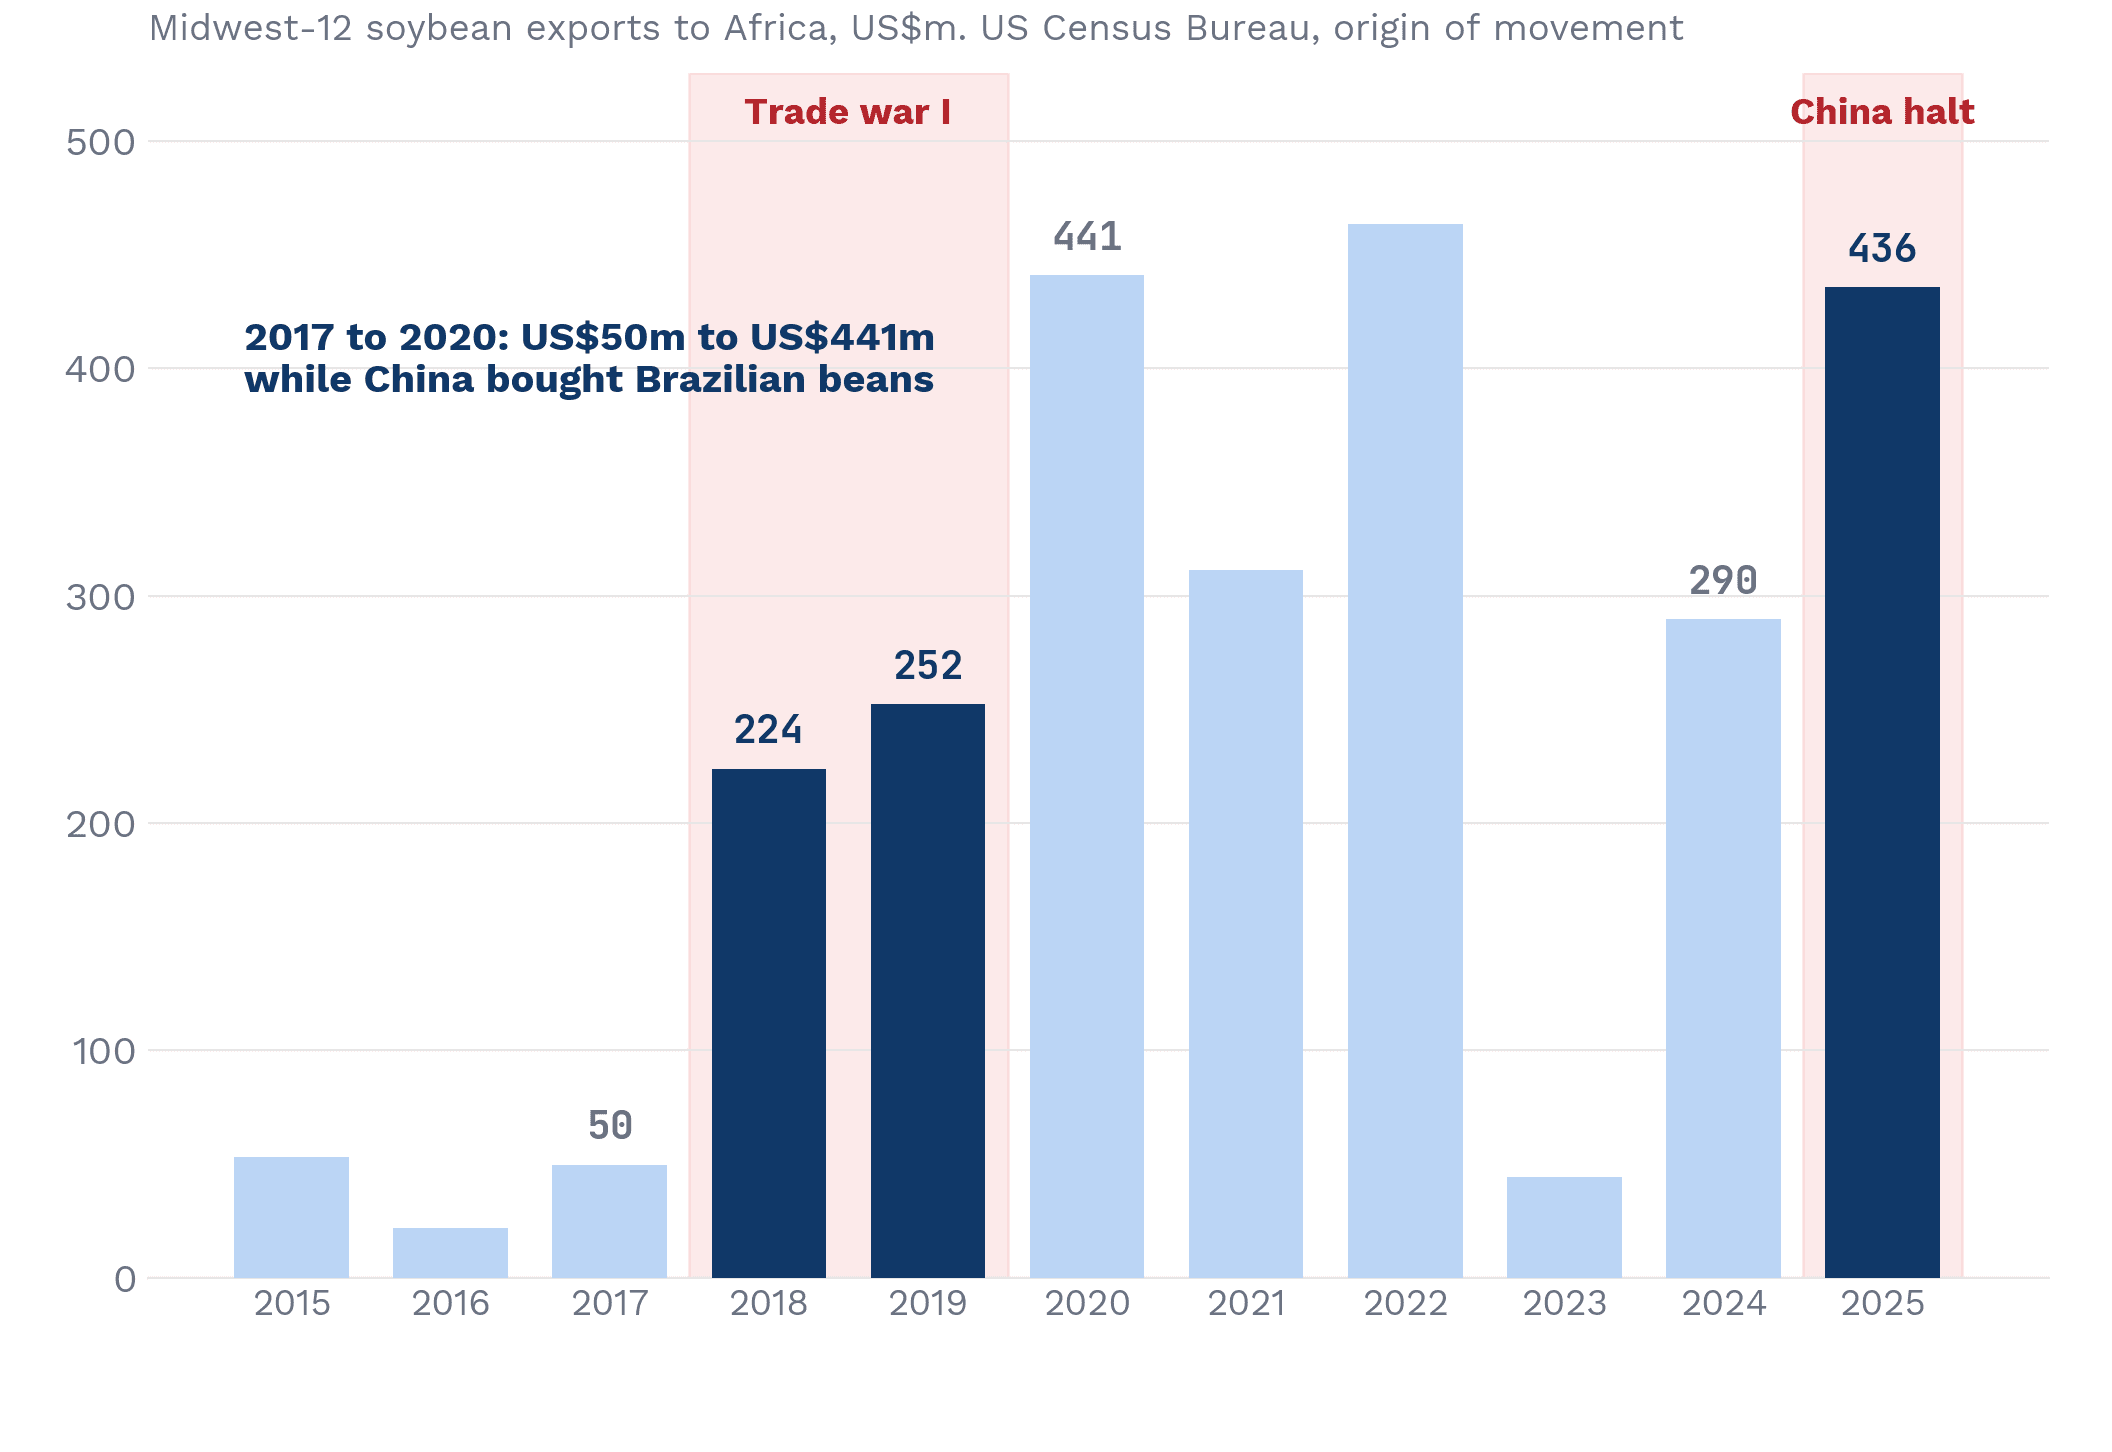
Midwest soybeans to Africa reached a record US$436m in 2025, US$355m of it to Egypt and US$334m of that from Illinois. The gain of US$146m over 2024 is under 1% of the US$16bn China loss. Yet Egypt gained more share of US soybean exports than any other named market, from 4.6% to 10.2%, and became the fourth-largest buyer of US soybeans by value at US$1.73bn for the year, behind China, Mexico and the European Union. Marketing-year 2025/26 commitments to Egypt are up 42% while China's are down 45%.
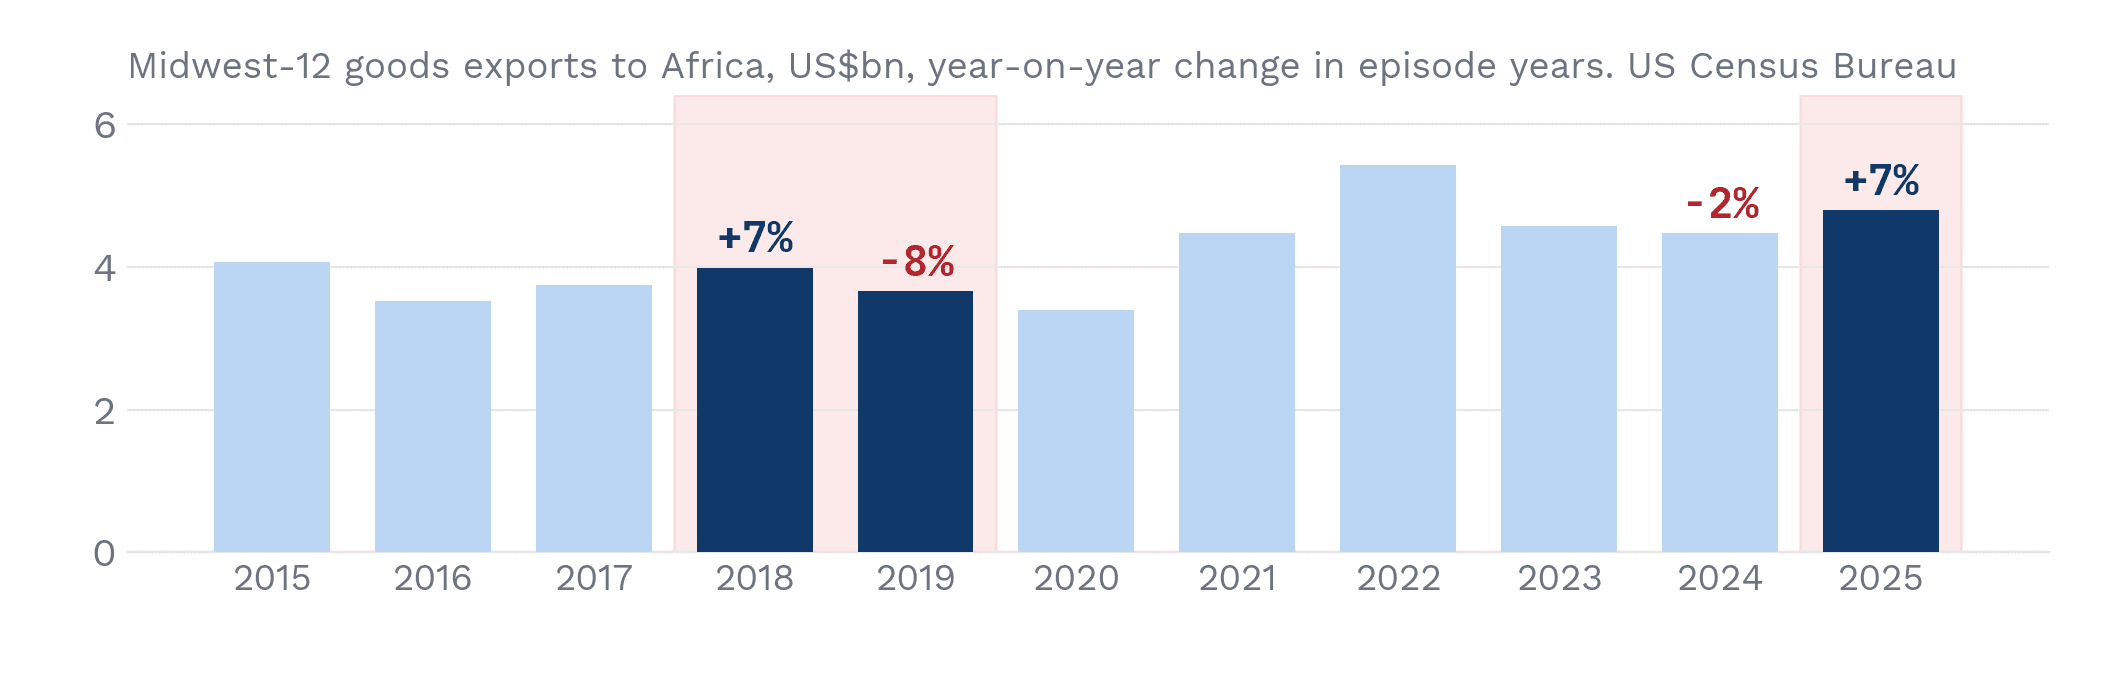
The corridor as a whole grew. The twelve Census Midwest states exported US$4.80bn of goods to Africa in 2025, up 7.3%, while total Midwest goods exports were flat at about US$385bn. Passenger cars doubled to US$298m, with Nigeria taking US$95m and Ghana US$58m. South Africa, Egypt and Morocco take 64% of the lane. The Midwest still lagged its own country: US exports to all of Africa rose 24% to US$40.3bn, the fastest-growing US export region of 2025, and the Midwest share of that trade slipped from 13.7% to 11.9%. The capital goods the Midwest makes, tractors, pumps and dosed medicines, fell. That gap is the opportunity for state trade agencies.
The comps: China, the EU and the 2018 precedent
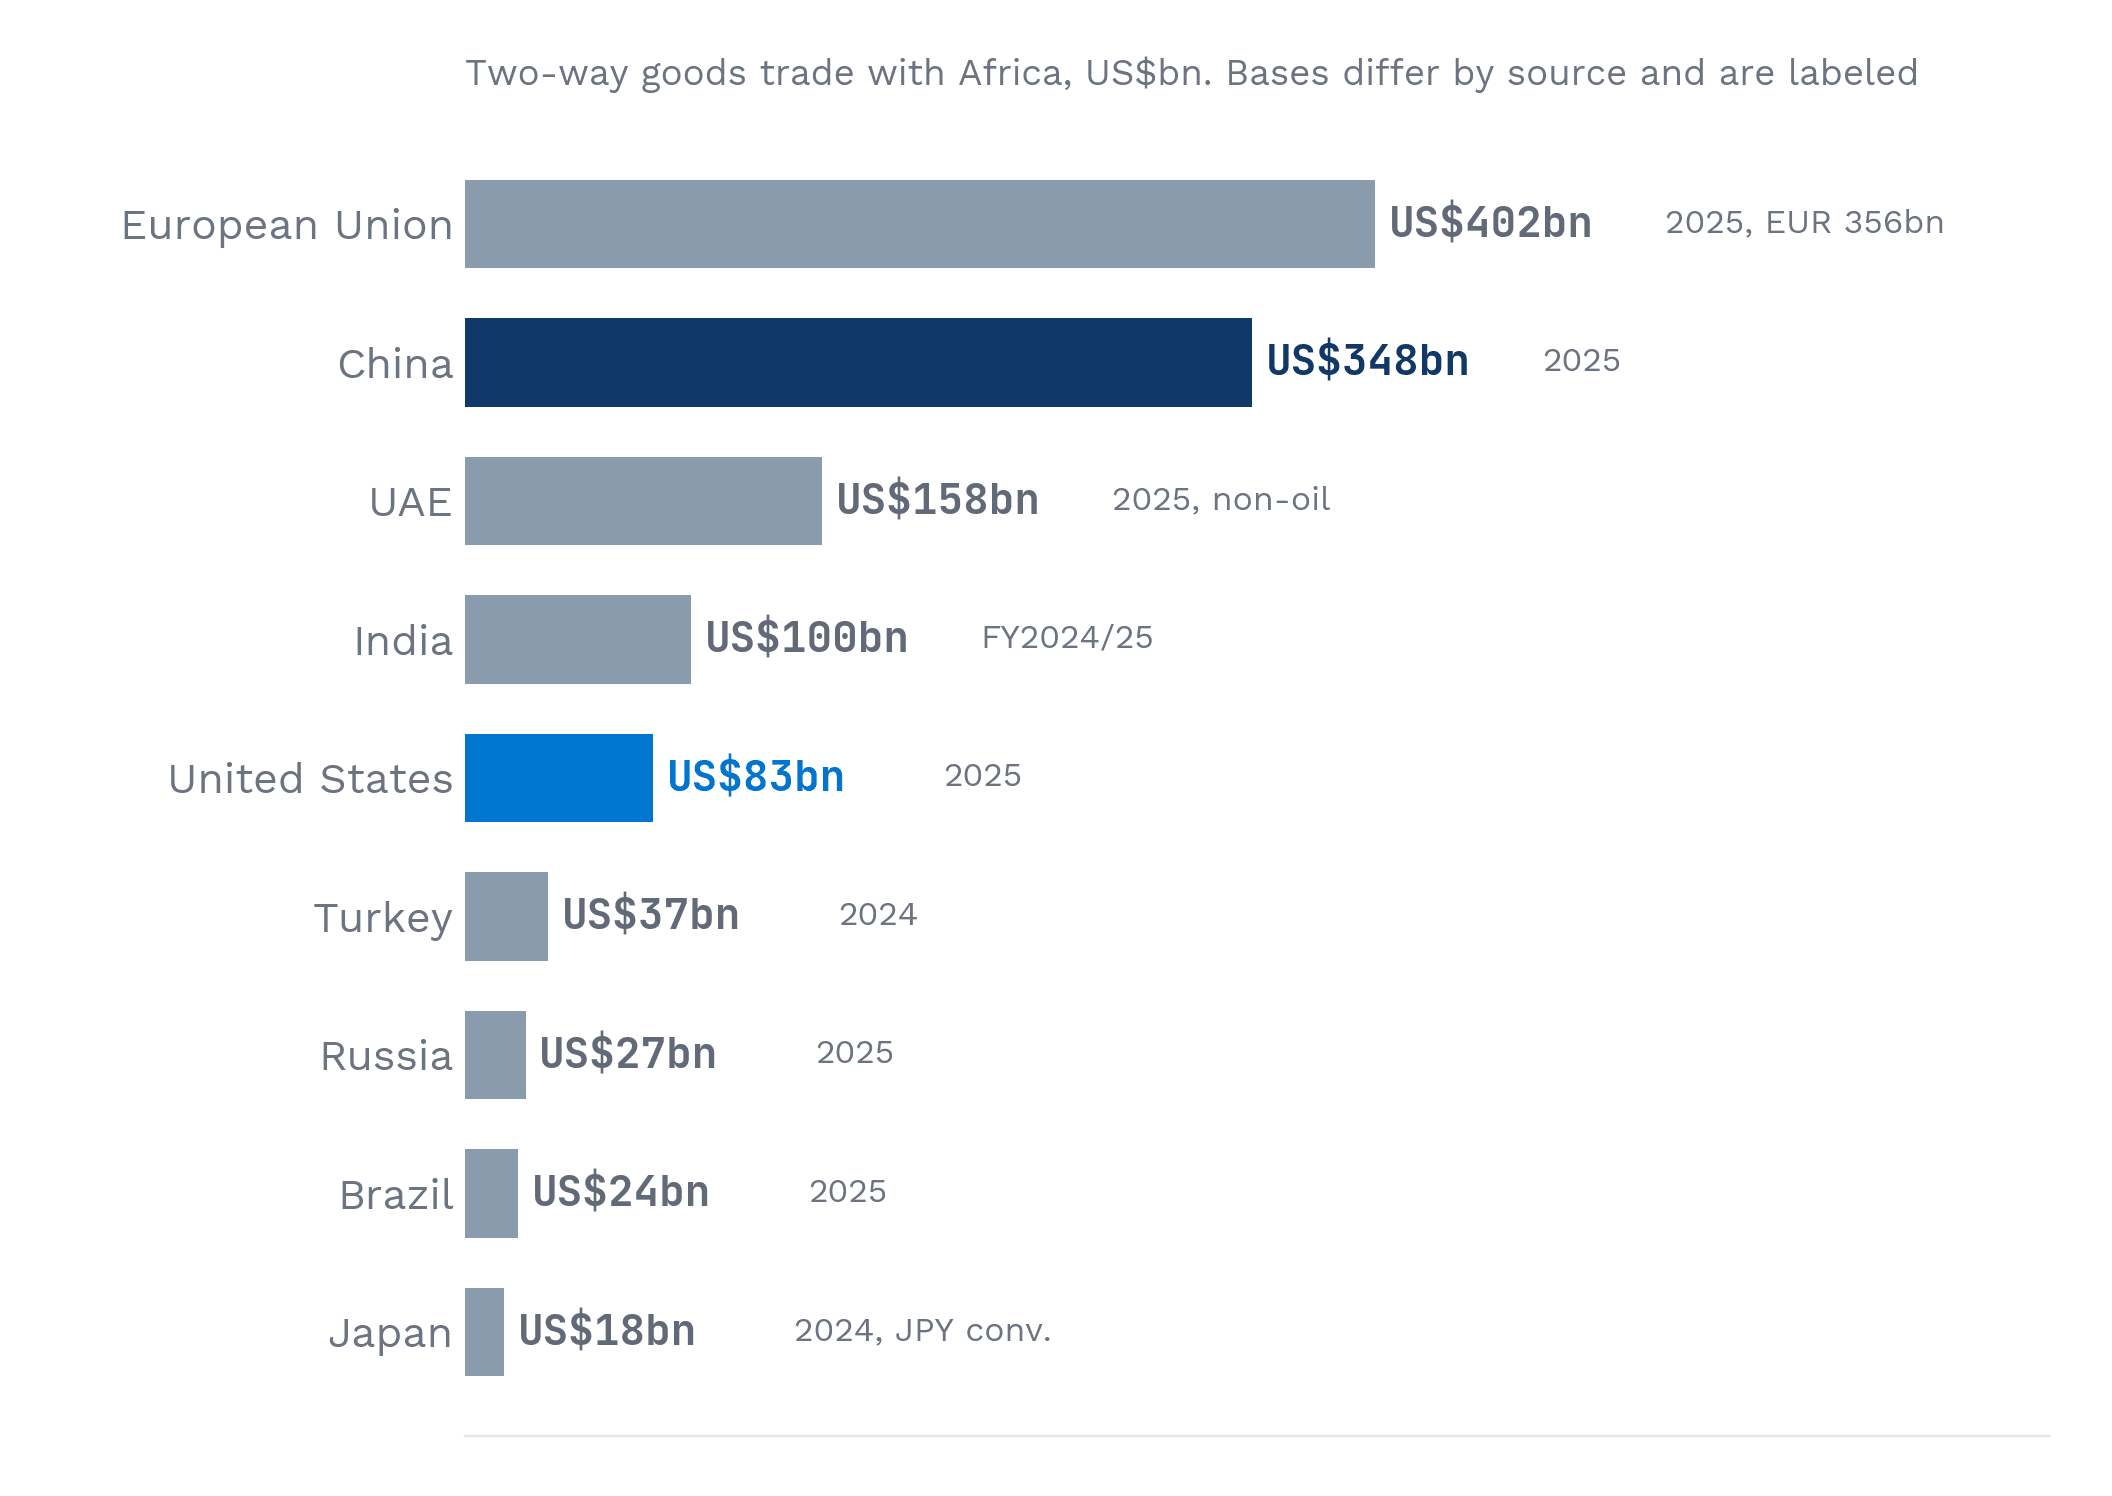
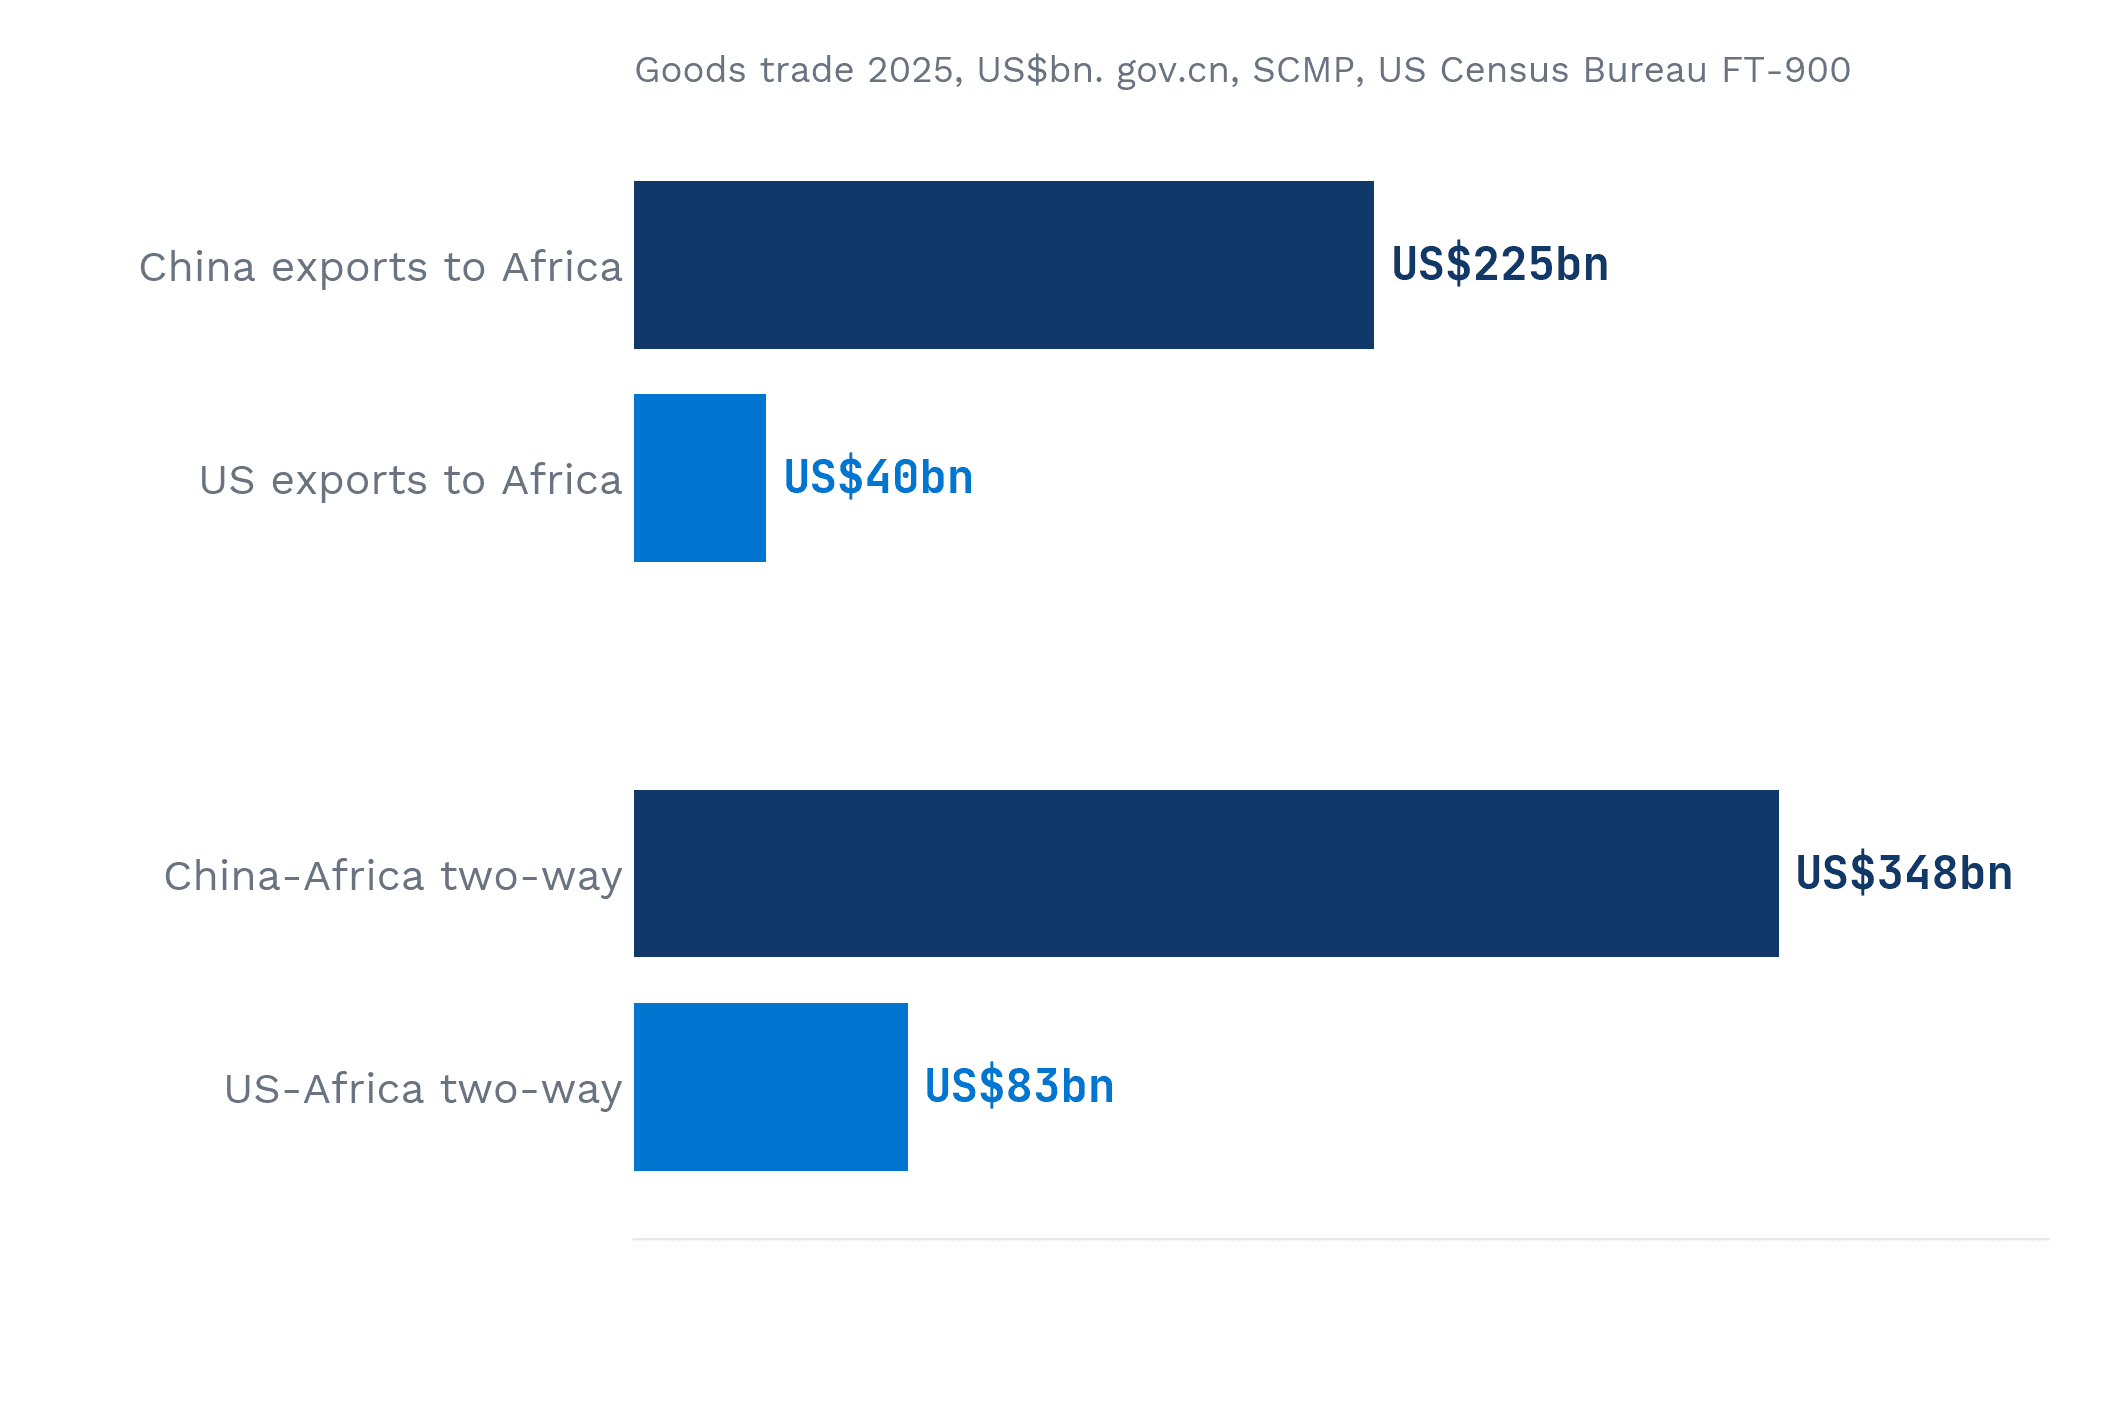
The United States is Africa's fifth trading partner. On two-way goods trade it sits behind the European Union at EUR 356bn, about US$402bn, China at US$348bn, the UAE at US$158bn on a non-oil basis and India at US$100bn, with US$83bn. China sells Africa 5.6 times what the United States does, US$225bn against US$40bn, and from May 1, 2026 charges zero tariffs on goods from the 53 African countries it has relations with. Beijing announced the policy in June 2025 as US reciprocal rates bit, and switched it on while AGOA ran on a one-year leash.
Washington moved the other way on the eve of the vote. On November 2, 2026 USTR notified Congress and the governments of South Africa and Rwanda of the intent to terminate their AGOA eligibility effective January 1, 2027. AGOA itself runs to December 31, 2028, and South Africa supplied about half of 2024 AGOA imports. Kenya, Ghana, Côte d'Ivoire, Lesotho and Madagascar carry no additional US tariff under the regime in force since July 24, 2026, the best US-access position those markets have had since April 2025.
The 2018 precedent says what to expect. In the first trade war China's share of US soybeans fell from 61% to about 28%, Washington paid US$23bn in Market Facilitation Program aid, and Midwest soybeans to Africa went from US$50m to US$441m by 2020. The aggregate corridor gave back its 2018 gain in 2019. The lane persisted, the headline did not. This cycle shows the same shape so far: China at about 30% of US soybeans, US$20bn of aid announced, and Egypt holding the lane.
Ten days in January decide the corridor
Three dates land inside ten days. On January 1 South Africa leaves AGOA unless USTR publishes a reinstatement path, and autos, citrus and wine reprice to MFN plus Sections 301 and 232. On January 3 the new Congress sits: hearings, refund bills and war-powers votes are certain, and a veto-proof tariff rollback is not. On January 10 the China truce expires. If it lapses, soybean basis and freight reprice within weeks, and Africa cannot absorb the volume.
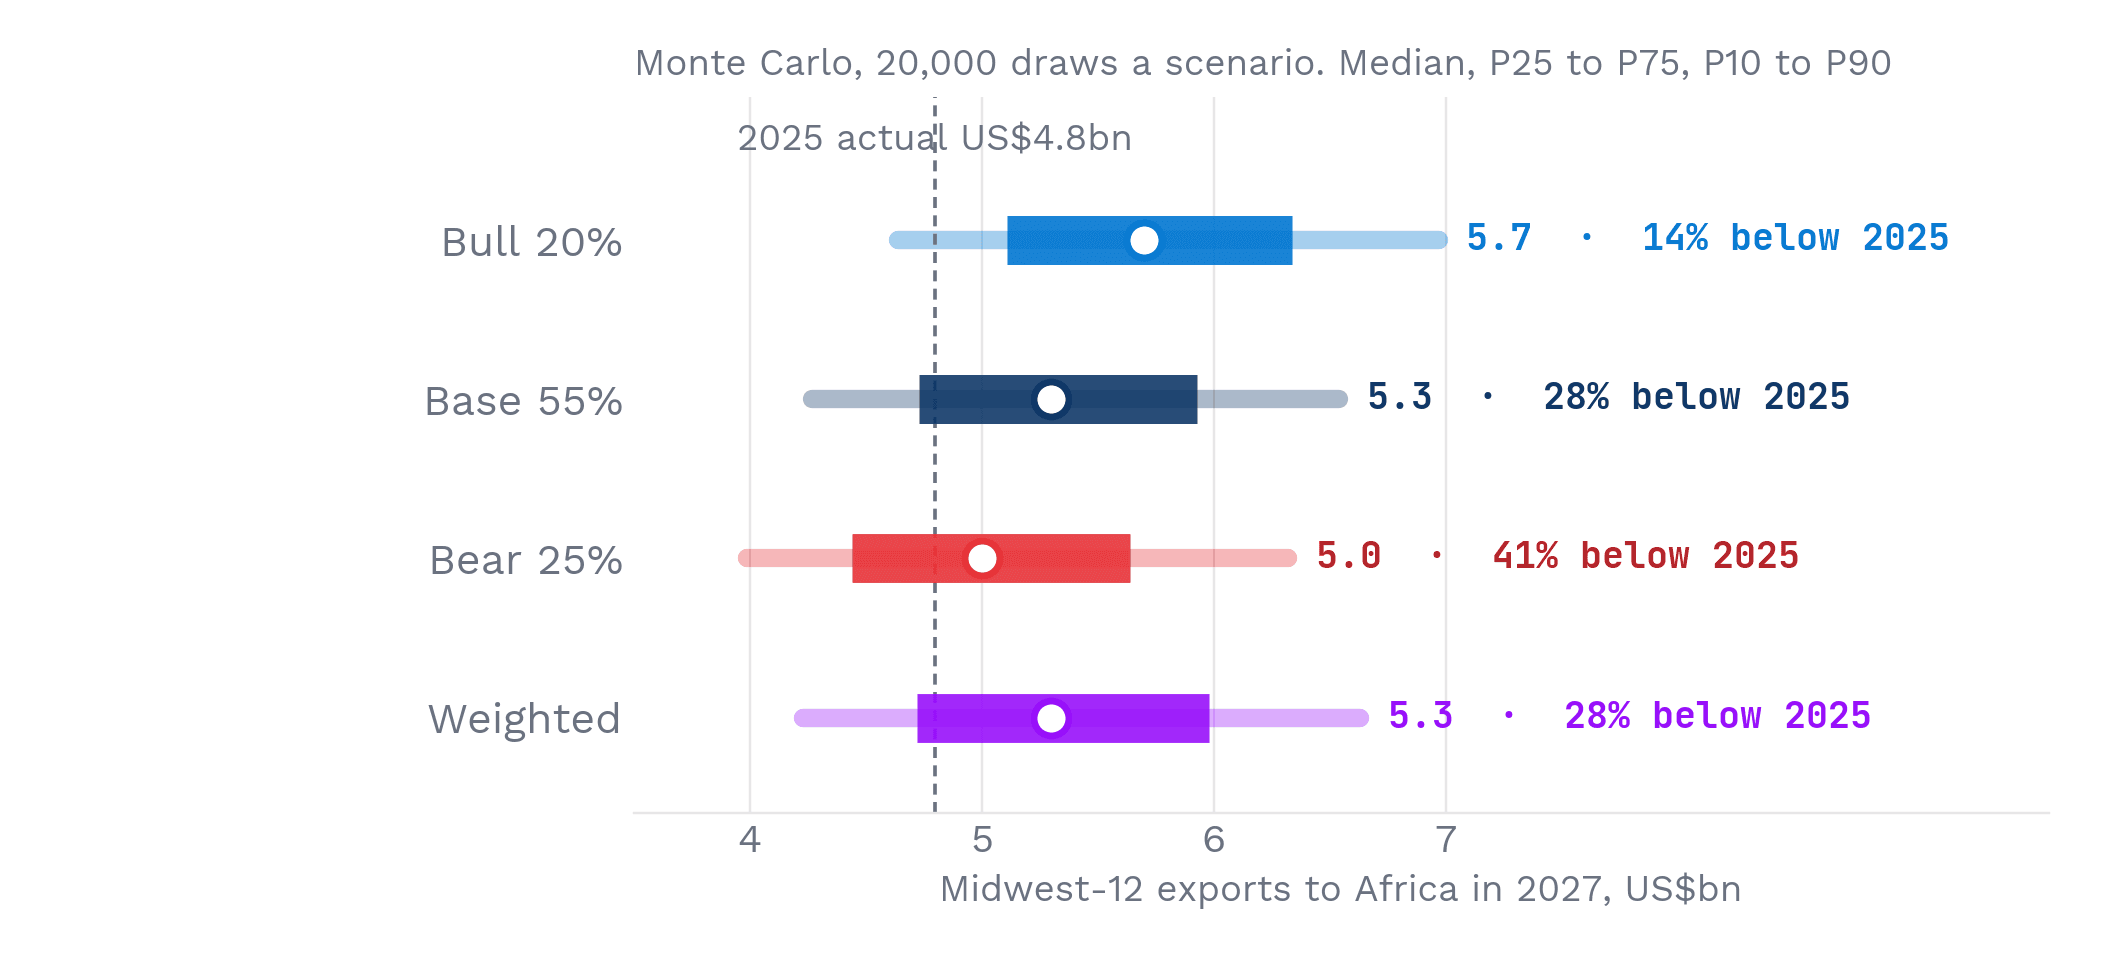
Kilwa's scenarios to mid-2027. Bull, 20%: South Africa reinstated, farm market access and a narrower Section 301, with a USTR reinstatement roadmap before January 1 as the first signal. Base, 55%: stalemate, with hearings on AGOA eligibility and exemptions, Senate votes on tariff repeal followed by a veto, tariffs near 11% and the truce rolled quarter by quarter. Bear, 25%: escalation, with the termination proceeding, Section 301 widened and Beijing letting the truce lapse on January 10. A Monte Carlo built on each lane's own 2015 to 2025 history puts Midwest-12 exports to Africa at US$5.3bn in 2027, with a 28% chance of landing below 2025.
Two of the eight signposts Kilwa tracks are already breached: the South Africa termination notice, and gasoline, which needed to be back under US$3.50 and stood at US$4.15 on Election Day. The rest resolve inside ten weeks, which is why this is a January call rather than a 2027 call. Probabilities are Kilwa judgments as of November 4, 2026, not frequencies or forecasts of returns, and every dated signpost is graded in public in the next edition.
The Kilwa View: five lanes, sized honestly
Africa cannot replace China. The 2025 soybean gain to Africa was under 1% of the China loss and will stay a rounding error against US$16bn. But Midwest exports to Africa grew 7.3% under the tariff regime while the Midwest total stood still, its lanes answer the shock the Corn Belt just voted on, and in 2018 the lane the first trade war opened never closed. Relief at the margin is still relief, and it compounds.
The asymmetry is in access. US access improves on the exempt lane, where AGOA runs to 2028 and no additional tariff applies, while China's access improves faster with zero tariffs for 53 countries. The winners are not the farm states that swung: Iowa and Kansas sell under 2% of their exports to Africa. They are Illinois with soybeans to Egypt, Michigan with vehicles out and platinum catalysts in, Indiana, and the DFIs, platforms and exporters that can underwrite Egypt, Nigeria and the exempt lane with crush capacity and dealer finance. Demand is not the constraint. Africa imported US$789bn of goods in 2025, the WTO expects its imports to grow 8.9% in 2026 against 3.9% for world trade, and the DFC's exposure ceiling was lifted to US$205bn in December 2025 while its FY2025 commitments fell to US$3.6bn. The constraint is US access, finance and product fit, which is why January matters more than the 2027 growth rate.
- 01The exempt lane, to 2028Kenya, Ghana, Côte d'Ivoire, Lesotho and Madagascar: AGOA duty-free and no additional US tariff. Apparel, cocoa and horticulture. The signal is the Ways and Means AGOA calendar.
- 02Egypt: the lane that survived 2018 and 2023US$355m of Midwest soybeans in 2025, US$334m of it from Illinois, plus wheat. The signals are Egypt's reserves and the USDA weekly export sales.
- 03Nigeria and Ghana: vehicles and biologics, financedCars doubled to US$298m, Nigeria US$95m and Ghana US$58m. Finance is the constraint. The signals are Nigeria's vehicle tariffs and the naira.
- 04The capital-goods gap the Midwest makesTractors, pumps and medicines fell in 2025. Kilwa's Corridor Report No. 1 maps the 32 cells where the gap is widest, the mission list for state agencies. The signal is the EXIM and DFC pipeline.
- 05South Africa: the reinstatement optionHalf of AGOA trade leaves on January 1 unless USTR publishes a path, and autos, citrus and wine reprice to MFN. Reinstatement is the Bull case at 20%. The signal is a USTR roadmap before January 1.
“Relief at the margin is still relief, and it compounds.”
What would prove us wrong
A January 1 termination with no reinstatement path. A lapsed China truce on January 10 that reroutes US soybeans to Africa at distressed basis, volume up and margin down. Or an Egypt FX event like 2023, when the lane fell to US$44m in a single year. Confidence is moderate: the base case carries 55%, two of the eight signposts are already breached, and the 2018 comp says the aggregate gives back. Kilwa grades every dated signpost in public in the next edition of Africa Signal Check.
Five things the briefing does not claim, because they could not be verified on November 4: final seat counts, with about 75 House races and two Senate races uncalled; county-level swings in farm and auto counties, which rest on statewide outcomes and reporting rather than precinct data; state-level exit polling on tariffs or the war in any Midwest state; a decomposition of the swing between tariffs, the war, candidate quality and turnout, which no analyst has produced and which Kilwa's two-step reading infers from the polling chronology; and the result pages of several national outlets, which were blocked during the research window. Calls and times are verified for CBS and NBC.
The numbers
- 7
- Senate seats flipped on November 3, six of them in states Trump won in 2024. Three were in the Midwest: Iowa, Kansas and Ohio
- 35%
- Chance of a seven-seat Senate loss at 38% approval on the 1938 to 2022 base-rate model. The map, not the penalty, is the surprise
- 38%
- Presidential approval in exit polls, on pace for the lowest for a president in a midterm (CBS News)
- US$4.15
- AAA gasoline on Election Day, a record for any Election Day. Midwest diesel hit US$6.35 in September
- 6.8 pts
- Consumer sentiment lost per US$1 on a gallon of gasoline, January 2025 to September 2026 (OLS, p < 0.01, R² 0.35)
- 4.2%
- Unemployment during the war months, unchanged from before it. A price shock, not a jobs shock
- US$16bn
- Drop in US farm exports to China in 2025, from US$24.4bn to US$8.4bn. Midwest Chapter 12 farm bankruptcies rose 70%
- +7.3%
- Midwest-12 goods exports to Africa in 2025, to US$4.80bn, while total Midwest goods exports were flat at about US$385bn
- US$436m
- Record Midwest soybean exports to Africa in 2025, US$355m of it to Egypt. The US$146m gain is under 1% of the China loss
- US$5.3bn
- Kilwa's probability-weighted median for Midwest-12 exports to Africa in 2027, with a 28% chance of landing below 2025
Election counts are unofficial as of November 4, 2026. Model outputs are Kilwa judgments as of that date, not forecasts of returns.
By market
Markets this report discusses.
Each market page gathers every tier the published reports print for that market, dated and linked to its source.
Series editor: Hinsley Njila, Founder & CEO. Prepared by the Kilwa Research team. research@kilwa.io
This report is research and analysis. It is not investment, legal or tax advice. Kilwa scores are structured risk rankings, not validated predictive models, except where explicitly stated otherwise. It is prepared for general circulation on a published schedule and is not tailored to any recipient.
Conflicts of interest. Kilwa does not hold, trade or take positions in the securities, currencies or instruments of the markets it scores, and receives no compensation from any government, issuer or institution in exchange for a score, a rating or favourable coverage. Where a research programme is funded by a named partner, that funding is disclosed in the report.