Liquidity Signal · No. 1
Exit and Liquidity 2026
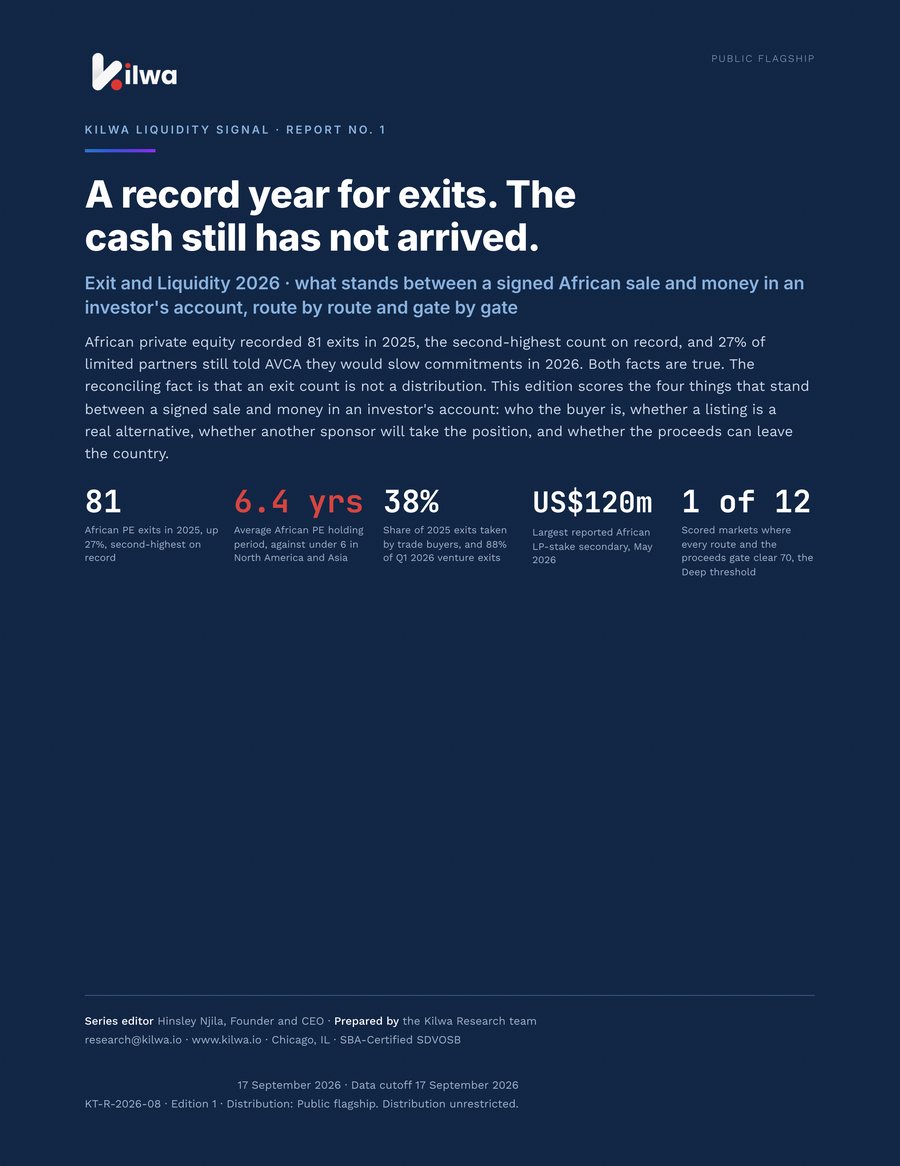
A record year for exits. The cash still has not arrived.
African private equity recorded 81 exits in 2025, the second-highest count on record, and 27% of limited partners still told AVCA they would slow commitments in 2026. Both facts are true, because an exit count is not a distribution. This edition scores the four things that stand between a signed African sale and money in an investor's account: who the buyer is, whether a listing is a real alternative, whether another sponsor will take the position, and whether the proceeds can leave the country.
Series editor Hinsley Njila, Founder & CEO · Prepared by the Kilwa Research team
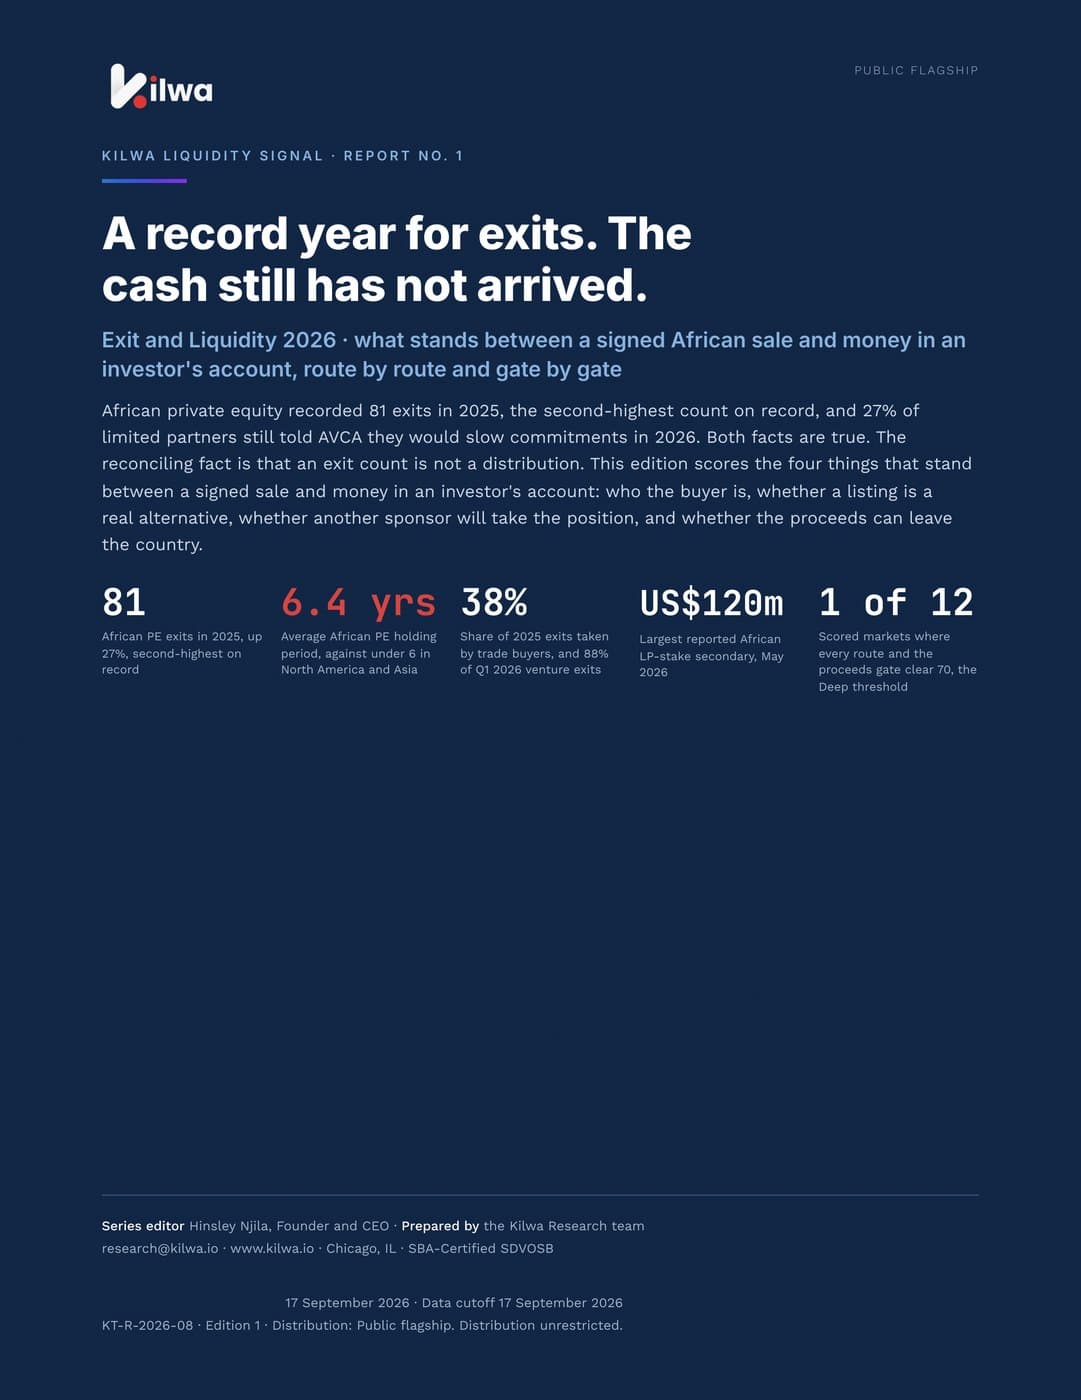
scored markets where every exit route and the proceeds gate clear 70, the Deep threshold: South Africa, at 78.2 on the Exit Liquidity Index
Key takeaways
- 01
Underwrite the buyer, not the multiple, in any market where the trade bid is the only bid. Trade buyers took 38% of 2025 exits and 88% of first-quarter 2026 venture exits.
- 02
Price the holding period at 6.4 years and test the return at eight. The share of African exits inside five years has fallen from 33% in the early 2000s to 12%.
- 03
Treat the listing route as real only where a recent oversubscribed offer of comparable size actually cleared. In 2026 the issuers walking through the reopened window are states and founders, not sponsors.
- 04
Assume the secondary bid is available for fund stakes, not for assets. The largest reported African LP-stake secondary is US$120m, and the most natural sellers, DFIs, are often barred by mandate.
- 05
Read the proceeds gate off Atlas No. 3 before signing, not after. An open route behind a shut gate is not liquidity.
- 06
Combine the country band with the sector row before sizing: outside the top four markets, sector decides the exit route more than country does.
- 07
The 2022 and 2023 vintages reach average exit age between 2029 and 2031. The machinery has roughly twenty-four to thirty-six months to form before the cohort arrives.
The report, in brief
What it is, who it is for, and what you get.
How capital leaves an African position: an Exit Liquidity Index for 12 markets, a route screen for all 54.
Written for
Africa-focused GPs
Whether the next investment committee memo names a route or names a buyer, with the hold modelled at 6.4 years and stressed at eight.
Global LPs and allocators
Whether to re-up on a paper mark or on route breadth: exposure by index band, not by country.
DFIs and multilaterals
What a mandate bar on secondary sales now costs, against a documented exit backlog.
Corporate strategy teams
Where the seller's alternatives are thin, which is 34 of 54 markets on the route screen.
What you get
- The Exit Liquidity Index for twelve markets, all five factor scores printed with verified or estimate flags
- The route screen for all 54 markets: multi-route, trade-led, single-buyer or constrained
- Three work products to build this week: the asset route map, the portfolio route-concentration test, and eight questions before you sign
- Recomputed transaction multiples with the arithmetic shown, from 1.31 times book for control to 1.86 for a listed minority
- Three scenarios to 2028, a realisation clock and ten dated signposts that Kilwa grades in public
- 28 pages as a PDF, delivered the moment payment clears
The call
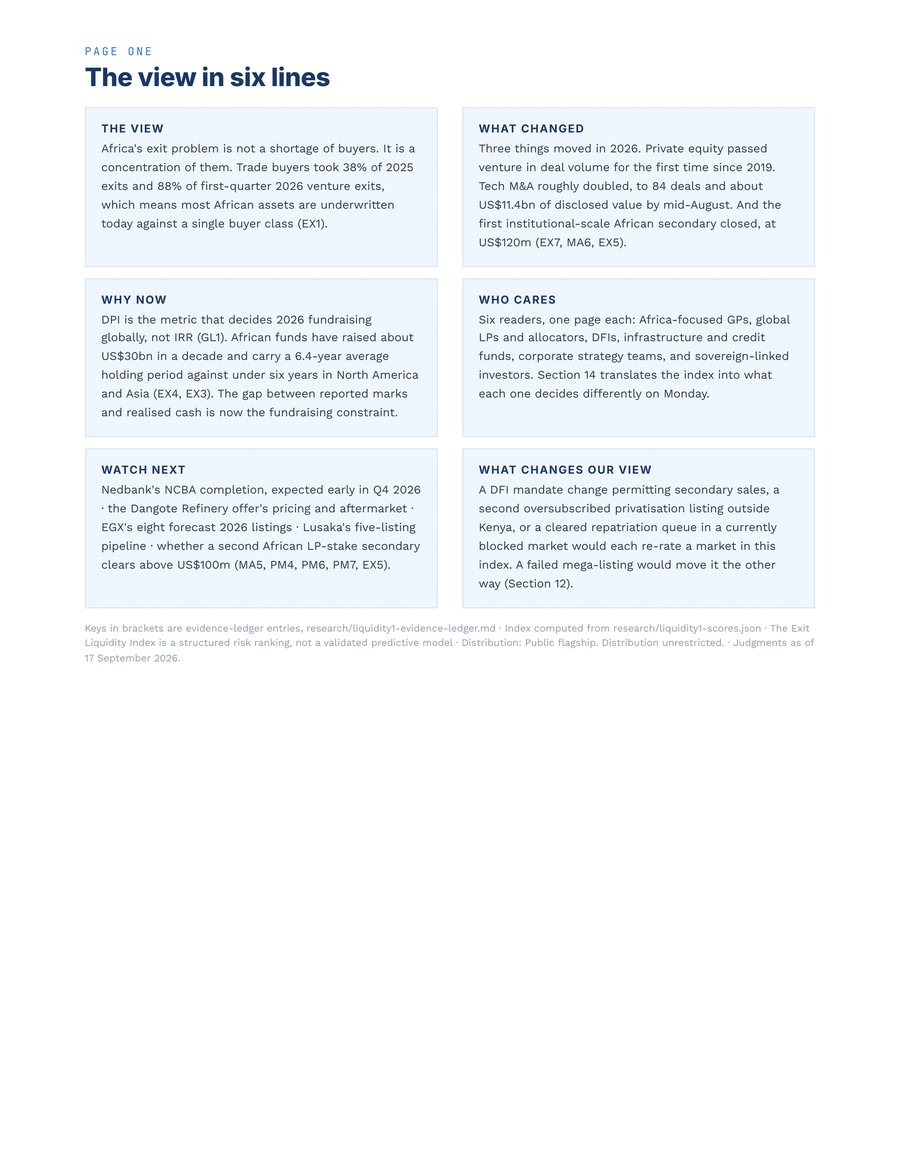
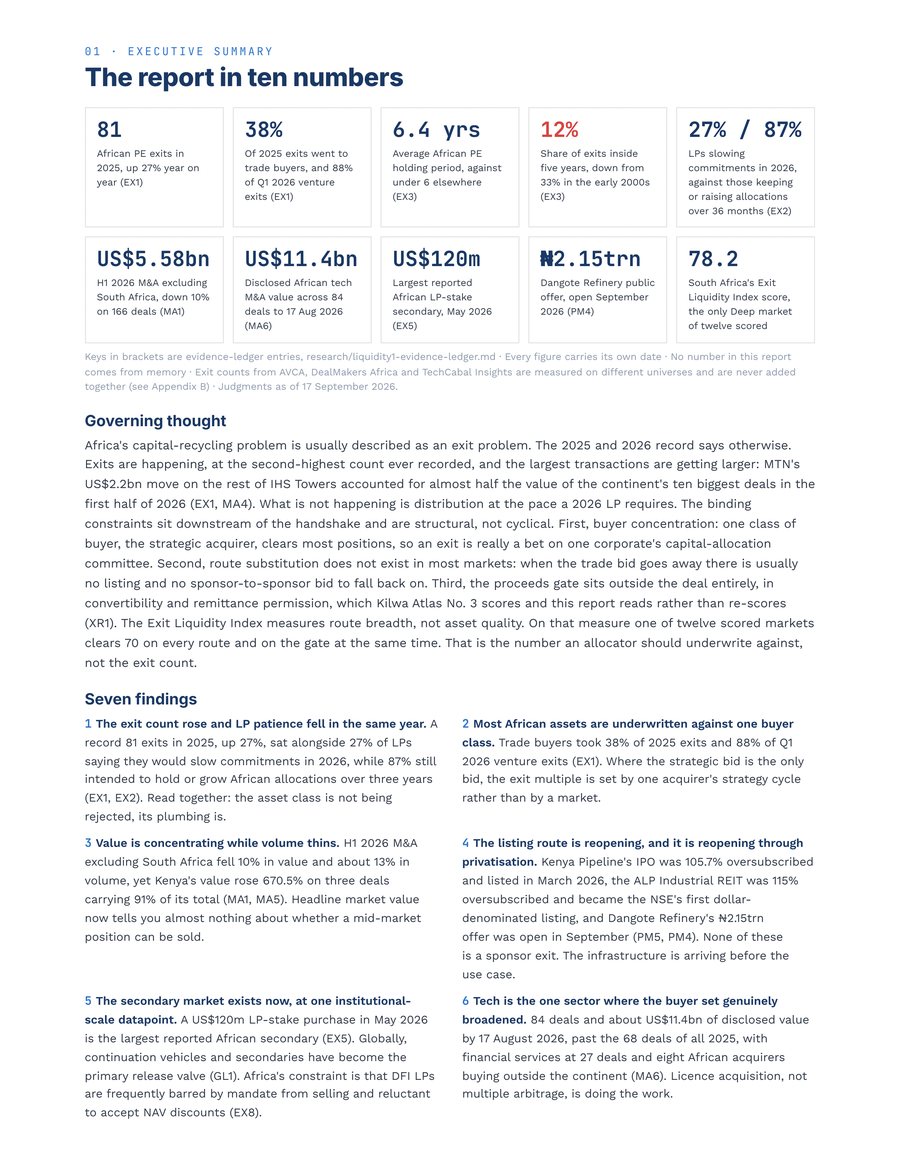
Africa's exit problem is not a shortage of buyers. It is a concentration of them. Exits are happening, at the second-highest count ever recorded, and the largest transactions are getting larger. What is not happening is distribution at the pace a 2026 LP requires. The binding constraints sit downstream of the handshake and are structural, not cyclical: one class of buyer clears most positions, route substitution does not exist in most markets, and the proceeds gate sits outside the deal entirely. The Exit Liquidity Index measures route breadth, not asset quality. On that measure one of twelve scored markets clears 70 on every route and on the gate at the same time. That is the number an allocator should underwrite against, not the exit count.
Exits are being counted. Distributions are being deferred
The clearest way to see the 2026 African liquidity position is to line up the counts against the cash. Deal formation held up and exit counts rose: 81 exits in 2025, up 27% and the second-highest on record. Fundraising did not follow, because the cash that would fund a re-up has not been returned. Twenty-seven per cent of LPs told AVCA they would slow commitments in 2026, while 87% still intend to hold or grow African allocations over thirty-six months. Read together, the asset class is not being rejected. Its plumbing is.
The rest of the record points the same way. M&A value excluding South Africa fell 10% in the first half of 2026, to US$5.58bn on 166 deals, while the ten largest transactions accounted for US$4.81bn of it and MTN's US$2.2bn move on IHS Towers took almost half. Private equity led deal volume for the first time in six years. The venture pipeline thinned to 146 disclosed deals and US$1.44bn in the half, with seed down 81% since 2021, which thins the 2030 exit cohort. Globally the same mechanism is running: distributions to paid-in capital have replaced IRR as the metric that decides a fund's next close, and African managers face that test with a 6.4-year average holding period.
The mechanism, stated plainly: a fund that must exit through a trade sale in a market with no listed comparable and no sponsor bid has one price-discovery event in its life, at the end. Its LPs cannot mark the position against a market, cannot sell the stake without a discount that DFI mandates often forbid, and cannot be paid until the single buyer decides. That is why a record exit count and a fundraising squeeze coexist.
“Route breadth, not deal flow, is what converts a mark into cash.”
Four routes out, and a gate at the end of all four
Capital leaves an African position through one of four routes: a strategic buyer, a public listing, another financial sponsor, or a fund-level secondary. Whichever route clears, the proceeds then pass a gate that has nothing to do with the deal, namely whether the currency converts at the official rate and whether the money is permitted to leave. The Exit Liquidity Index scores route breadth and gate condition together, because an open route behind a shut gate is not liquidity. Five factors, each scored 0 to 100 with a verified or estimate flag and a published weight: strategic-buyer depth 25%, public-market exit viability 20%, sponsor and secondary bid 20%, proceeds mobility 20%, legal and transfer execution 15%. Proceeds mobility is read from Kilwa Atlas No. 3 and not re-derived, so the two publications cannot disagree.
The index has the opposite polarity to Kilwa's risk frameworks: a high score is good. It therefore carries its own four-band scheme, never compared with a risk tier: Deep at 70 and above, Functioning from 55 to 69, Thin from 40 to 54, Blocked below 40. Twelve markets carry a score because scoring strategic-buyer depth needs observable completed transactions and scoring the listing route needs a real recent offer. The other forty-two are screened on which routes structurally exist, a settled fact rather than a time-sensitive statistic. Estimate density is high in this edition and is disclosed as such: nine of sixty factor cells are verified, and three factors are entirely estimate-flagged.
In most of Africa there is one way out, and it is a phone call to a corporate
The route screen classifies all fifty-four markets on whether a functioning exchange hosts listings of relevant size, whether completed corporate acquisitions are observable, and whether financial sponsors transact. Six markets are multi-route: South Africa, Egypt, Morocco, Nigeria, Kenya and Mauritius. Fourteen are trade-led, eighteen depend on a single buyer class, and sixteen are constrained by conflict, sanctions exposure or a shut proceeds gate. Six markets offer more than one live route. Thirty-four have one realistic route or none.
Route availability tracks financial-market depth, not GDP and not growth. Rwanda and Senegal are well-regarded reform stories with thin exit routes; Angola is a large economy in the single-buyer class. The practical consequence for a fund is that diversification across African markets does not diversify exit route. A pan-African portfolio can be twelve countries deep and still have one exit mechanism. A single large transaction can reclassify a market, and the report commits to publishing reclassifications in the next edition rather than silently.
One Deep market, five Functioning, and a long tail
Twelve markets carry a score, from 78.2 to 24.0, and the shape of the distribution matters more than the ordering. South Africa is the only market that clears 70 on every route and on the gate; its binding constraint is price, not route. Mauritius ranks second on a different basis from every other market, because its score is built on structuring and mobility rather than on domestic buyers. That is a real result and also a caution: it is not a claim that a holding-company jurisdiction fixes an operating-company gate in the market where the asset actually sits.
Read route and gate together and two cells decide most portfolios. Nigeria and Egypt sit in the awkward cell: real buyers, real exchanges, a constrained gate. They are where the most African private capital is concentrated and where the distinction between an exit and a distribution does the most damage to a fund's DPI. Ghana, Zambia, Tanzania and Ethiopia sit in the cell where neither half works, and where a position should be sized as illiquid from the first day rather than re-underwritten at year five. Tanzania at 39.9 falls one tenth of a point below the Blocked line and keeps its band in 53.3% of Monte Carlo draws: a boundary case, not a verdict.
“A signed sale is not a distribution until the money is allowed to leave.”
The listing window reopened, and the release valve is barely plumbed
For most of the last decade the African IPO was not an exit route. In 2026 the mechanics started working again, but the issuers are states and founders, not sponsors. Kenya Pipeline Company's IPO was 105.7% oversubscribed and listed in March 2026, the ALP Industrial REIT was 115% oversubscribed and became the Nairobi exchange's first dollar-denominated listing, and Nigeria's Dangote Refinery had a ₦2.15trn offer open in September. A sponsor should read this as proof the pipes work, not as proof its own asset can use them. And a sponsor exiting into a local-currency listing owns the translation risk between pricing and remittance: a cleared listing in a market with a constrained gate is a change of asset class, not an exit.
Globally the answer to a shut exit window has been continuation vehicles and secondaries. Africa has the same problem and much less of the machinery. The largest reported African LP-stake secondary is US$120m, transacted in May 2026, against roughly US$30bn raised by African funds over the past decade: a first datapoint, not a market. The structural reason is the composition of the LP base. Many African funds count DFIs among their largest investors, and DFIs are frequently constrained by mandate from participating in secondaries and reluctant to sell at a discount to net asset value. A secondary market needs a motivated seller; in Africa the largest holders are often the least able to be one. Technology is the exception to the concentration story: 84 deals and about US$11.4bn of disclosed value by mid-August 2026, past the 68 of all 2025, with acquirers buying licences and agent networks rather than earnings.
Control at 1.31 times book. A minority top-up at 1.86 times, undersubscribed
One section asks what each route pays, using only prices that can be recomputed from published figures. Two Kenyan bank transactions in 2026 involved listed targets with audited accounts. Nedbank agreed to acquire a 66% controlling interest in NCBA at about 1.31 times published book value, and shareholders representing 77.54% accepted. Absa's tender for a minority top-up in Absa Bank Kenya, priced higher at about 1.86 times book, was reported undersubscribed. Both priced above the 6.22 times listed banking-sector earnings multiple, so neither price was distressed.
Kilwa's reading of the pair, stated as a reading rather than a reported fact: the two prices differ by the seller's alternatives rather than by asset quality. A control block has no exchange to sell into, while a listed minority can sell on any trading day and can therefore decline. Route breadth is the option, and this pair is the closest thing to a public price for it. The limitations are printed in full: the comp set is three transactions, all listed, concentrated in banking and telecom, on announced rather than completed terms, and no exit multiple is published for any private African asset because none can be recomputed from a primary source.
What each reader decides differently on Monday
The report translates the index into one decision for each of six readers. These are frameworks for sizing conversations, not recommendations, and they are tailored to no recipient or portfolio.
- 01Africa-focused GPsWhether the exit case in the next fund's investment committee memo names a route or names a buyer. Publish a route map per portfolio asset, model the hold at 6.4 years and stress it at eight.
- 02Global LPs and allocatorsWhether to re-up on a paper mark or on a route-breadth view of the remaining portfolio. Ask for exposure by index band, not by country, and confirm whether your own mandate permits a secondary sale before you need one.
- 03DFIs and multilateralsWhether the mandate constraint on secondary participation is still serving the development objective it was written for. Price the cost of being the LP that cannot sell.
- 04Infrastructure and credit fundsWhether the terminal-sale assumption in the base case should be there at all. Underwrite to contracted cash flow and refinancing, not to a sale.
- 05Corporate strategy teamsWhether now is the moment to be the buyer rather than the partner. The seller's alternatives are thin in 34 of 54 markets on the route screen.
- 06Sovereign-linked investorsWhether to provide the liquidity that is missing rather than compete for the assets that are not. The secondaries and continuation gap is the least contested position in African private capital.
Three paths through 2028, and the wall behind them
The scenarios are built on mechanisms in the 2024 to 2026 record, not on a simulation, and the probabilities are Kilwa subjective judgments as of the publication date, not measured frequencies and not forecasts of returns. Concentrated grind, 50%: trade buyers stay dominant, value concentrates in a few large deals, secondaries stay episodic and fundraising bifurcates by DPI. Plumbing catches up, 30%: secondaries clear at published discounts, one DFI mandate opens to secondary sales, privatisation listings keep clearing oversubscribed, and the holding period compresses toward 5.5 to 6.0 years by 2028. Backlog bites, 20%: a mega-listing prices poorly or a large trade process fails, the strategic bid pauses, and the 2021 to 2023 vintage reaches end of life unexited.
There is a dated reason this matters now. Africa-focused vehicles raised at record levels in 2022 and 2023, between US$3.5bn and US$4.2bn a year, the last cohort to close at that scale. At a 6.4-year average hold those assets reach average exit age between 2029 and 2031, and on a standard ten-year term the funds themselves reach end of life around 2032 and 2033. Against that, the secondary market has one public institutional-scale print and its most natural sellers are constrained by mandate. Signing to cash is itself a band-dependent assumption: six to nine months in a Deep market, nine to fifteen in a Functioning one, fifteen to twenty-four plus the buyer search in a Thin one, and indeterminate where the route is Blocked.
What would change our view
Four named assumptions hold the report up: that trade-buyer concentration persists, that privatisation listings do not generalise to sponsor exits, that DFI mandate constraints remain binding on secondary supply, and that the proceeds gate moves slowly. A DFI mandate change permitting secondary sales, a second oversubscribed privatisation listing outside Kenya, or a cleared repatriation queue in a currently blocked market would each re-rate a market in this index. A failed mega-listing would move it the other way.
Ten indicators are listed in the order they would move, from the Dangote Refinery offer's pricing and first-month aftermarket, through the Nedbank and NCBA completion and the Lusaka listing pipeline, to a second African LP-stake secondary above US$100m and AVCA's next exit count. Kilwa will grade every dated signpost in the next edition of this series. Where a call was wrong, the next edition says so in the same place it was made. That is a research-quality commitment and not an invitation to trade.
What this report is not
Not a fund-manager ranking and not a view on any named GP's track record. Not a valuation or multiples study: this edition scores whether a route exists, not what it pays, and the one pricing section recomputes three listed transactions with its limits stated. Not a re-scoring of currency convertibility, which Atlas No. 3 owns. Not a validated predictive model: the Exit Liquidity Index is a structured risk ranking, and it is neither ISI nor METI. Not a secondary-market size estimate, since no published continental series exists. No motive is asserted for any named company, and transaction characterisations follow the reporting provider.
The numbers
- 81
- African private-equity exits in 2025, up 27% and the second-highest count on record, in the same year 27% of LPs said they would slow commitments
- 6.4 yrs
- average African PE holding period, against under six in North America and Asia; the share of exits inside five years fell from 33% in the early 2000s to 12%
- 38%
- of 2025 exits went to trade buyers, and 88% of first-quarter 2026 venture exits: most African assets are underwritten against a single buyer class
- US$120m
- the largest reported African LP-stake secondary, May 2026: a first institutional-scale datapoint, against roughly US$30bn raised by African funds in a decade
The model, in one table
The Exit Liquidity Index, twelve markets
| Band | Markets | What it means for an exit |
|---|---|---|
| Deep | South Africa 78.2 | Three or more routes clear and the gate is open. The binding constraint is price, not route. Signing to cash in six to nine months: model it as a working-capital question, not a return question. |
| Functioning | Mauritius 68.3, Kenya 64.8, Nigeria 61.1, Morocco 58.9, Egypt 58.8 | Two routes realistic, one dominant. Price the nine to fifteen months between signing and cash separately from the multiple. Nigeria and Egypt pair real buyers and real exchanges with a constrained gate; Mauritius scores on structuring and mobility rather than on domestic buyers. |
| Thin | Côte d'Ivoire 50.9, Senegal 44.4, Ghana 43.4, Zambia 41.6 | One route, buyer-specific. Start the buyer conversation three years out, not at exit, and contract the exit at entry. Zambia is scored on an announced rather than a cleared listing pipeline. |
| Blocked | Tanzania 39.9, Ethiopia 24.0 | No reliable route, or the gate shuts it. Size the position as permanently illiquid from day one and take the return from cash yield. Tanzania sits 0.1 under the line and keeps its band in 53.3% of draws: a boundary case, not a verdict. |
The Exit Liquidity Index runs 0 to 100 and higher is better, the opposite polarity to Kilwa's risk tiers, so its bands are never compared with a risk-tier band: Deep 70 and above, Functioning 55 to 69, Thin 40 to 54, Blocked below 40. Five weighted factors (strategic-buyer depth 25%, public-market exit viability 20%, sponsor and secondary bid 20%, proceeds mobility 20%, legal and transfer execution 15%), with proceeds mobility read from Kilwa Atlas No. 3. A structured risk ranking as of 17 September 2026, nine of sixty factor cells verified, not a validated predictive model, and neither ISI nor METI. Signing-to-cash durations are Kilwa assumptions anchored to named precedents, not measured medians.
By market
Markets this report tiers.
- Algeria
- Angola
- Benin
- Botswana
- Burkina Faso
- Burundi
- Cabo Verde
- Cameroon
- Central African Republic
- Chad
- Comoros
- Côte d'Ivoire
- Djibouti
- DR Congo
- Egypt
- Equatorial Guinea
- Eritrea
- Eswatini
- Ethiopia
- Gabon
- Ghana
- Guinea
- Guinea-Bissau
- Kenya
- Lesotho
- Liberia
- Libya
- Madagascar
- Malawi
- Mali
- Mauritania
- Mauritius
- Morocco
- Mozambique
- Namibia
- Niger
- Nigeria
- Republic of the Congo
- Rwanda
- São Tomé and Príncipe
- Senegal
- Seychelles
- Sierra Leone
- Somalia
- South Africa
- South Sudan
- Sudan
- Tanzania
- The Gambia
- Togo
- Tunisia
- Uganda
- Zambia
- Zimbabwe
Each market page gathers every tier the published reports print for that market, dated and linked to its source.
Series editor: Hinsley Njila, Founder & CEO. Prepared by the Kilwa Research team. research@kilwa.io
This report is research and analysis. It is not investment, legal or tax advice. Kilwa scores are structured risk rankings, not validated predictive models, except where explicitly stated otherwise. It is prepared for general circulation on a published schedule and is not tailored to any recipient.
Conflicts of interest. Kilwa does not hold, trade or take positions in the securities, currencies or instruments of the markets it scores, and receives no compensation from any government, issuer or institution in exchange for a score, a rating or favourable coverage. Where a research programme is funded by a named partner, that funding is disclosed in the report.